Introduction
Shipping costs are compressing margins across the board in 2025. Both FedEx and UPS have now announced 5.9% average general rate increases for two consecutive years — following a record 6.9% hike in 2023. Stack those GRIs on top of rising fuel surcharges, expanded accessorial fees, and new dimensional weight adjustments, and total U.S. business logistics costs hit $2.58 trillion in 2024, up 5.4% year-over-year.
For small parcel and freight shippers, these compounding increases are a structural problem — one that quietly erodes profitability with every invoice cycle.
Carrier rate optimization is the ongoing discipline of analyzing your shipping spend, benchmarking your rates against market norms, and negotiating agreements that reduce costs without compromising service quality. It's not a one-time renegotiation. Sustained savings require continuous monitoring, quarterly contract reviews, and proactive adjustment as carrier pricing shifts.
This guide walks through the full process: auditing your shipping spend, building negotiation leverage from your own data, restructuring carrier agreements, and maintaining savings as pricing continues to evolve.
Key Takeaways
- Carrier rate optimization is a continuous discipline, not a single contract renegotiation
- Start with a 6–12 month shipping spend audit to uncover billing errors, surcharge patterns, and service mismatches
- Build your negotiation case with market benchmark data — carriers analyze your account closely, and your team should too
- Accessorial fees, DIM weight divisors, and GRI caps often deliver more savings than base rate discounts
- Technology and expert advisory services turn optimization from an annual scramble into an ongoing competitive advantage
Start with a Shipping Spend Audit
Most businesses overpay without realizing it. Carrier invoices are dense, surcharges accumulate quietly, and billing errors routinely slip through. According to multiple freight audit platforms, shippers lose between 2% and 8% of total shipping spend to invoice errors, duplicate charges, and incorrect surcharges — on a $10 million freight budget, that's $200,000 to $800,000 in recoverable overcharges annually.
What an Audit Actually Involves
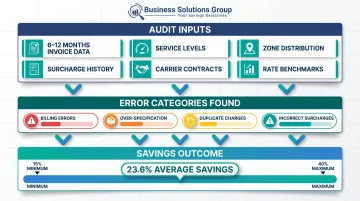
A shipping spend audit is a line-by-line review of carrier invoices, contract terms, surcharge schedules, and service level usage — ideally covering 6 to 12 months of shipment history. This window captures seasonal volume patterns and establishes a true cost baseline before any strategy is implemented.
Key data points to collect during an audit:
- Total parcel and freight volume by month and season
- Service levels used (Ground vs. Express vs. 2-Day)
- Package weights, dimensions, and DIM weight calculations
- Delivery zones and geographic destination patterns
- Recurring surcharges: residential delivery, fuel surcharges, delivery area surcharges, and address correction charges
Catching Over-Specification and Billing Errors
Audits consistently surface two high-value problems:
- Billing errors — wrong rates, misapplied discounts, incorrect surcharges, and duplicate charges that carriers rarely volunteer to correct
- Service over-specification — shippers default to premium or expedited services for shipments where Ground would arrive just as effectively
Shifting even 15–20% of non-urgent B2B shipments from 2-Day to Ground generates immediate, measurable savings.
BSG's audit process covers every element of transportation costs across parcel, LTL, FTL, ocean, air, and intermodal charges. Industry data — consistent with BSG's own findings — shows that 1 in 5 shipping invoices contains errors that go unchallenged without a formal review process.
BSG's typical clients see 15% to 40% reduction in small parcel costs — with an average of 23.6% identified through benchmark analysis alone. Audit findings account for the majority of that savings gap.
Establish a recurring audit cadence. Monthly or weekly post-audits catch billing discrepancies before payment. Quarterly strategic reviews use that data to trigger renegotiations, carrier mix adjustments, or dispute resolution. Done consistently, auditing shifts from a one-time exercise into an ongoing cost control mechanism that compounds savings over time.
Use Data and Benchmarking to Build Negotiation Leverage
Carriers design their rate structures to maximize revenue. Without objective benchmark data showing how your rates compare to market norms, you're negotiating from a position of weakness. Carriers have full visibility into your account history — your volumes, service mix, zone distribution, and surcharge exposure. You should have the same.
What Pre-Negotiation Analysis Looks Like
Effective benchmark analysis means comparing your actual contracted rates and surcharge levels against what companies of similar size, industry, and shipping volume are actually paying today — not published list rates, but real negotiated rates.
Strong pre-negotiation analysis covers:
- Lanes and service types where you're paying above-market rates
- Total cost-per-package including accessorials, not just base rates
- DIM weight penalties inflating costs (DIM pricing can inflate shipping costs by 40–200% compared to actual weight billing)
- Volume, geographic density, and growth trajectory — all of which give you concrete leverage to request tiered discounts
Business Solutions Group benchmarks clients' parcel invoice data down to one-tenth of a percent, projecting market-appropriate rates for each service and surcharge category before any negotiation begins. Their pre-negotiation analysis takes roughly one week and is completed before any client commitment.
That benchmark foundation matters most when you reach surcharges — which most shippers leave on the table entirely.
Surcharges Deserve Their Own Negotiation Track
Most shippers negotiate base rate discounts and treat surcharges as fixed line items. That's a costly mistake.
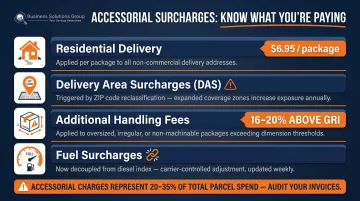
Accessorial fees represent 20–35% of total parcel shipping spend — reaching 40% during peak season. If accessorials exceed 20% of your overall spend, that's a clear signal your contract needs restructuring.
Each of the following surcharge categories has room to move in a well-structured negotiation:
- Residential delivery surcharges (FedEx's 2026 charge reached $6.95 per package)
- Delivery area surcharges — especially after ZIP code reclassifications expand rural designations
- Additional handling fees, increasing 16–20% above the standard GRI year over year
- Fuel surcharges — now largely decoupled from actual diesel prices, functioning as margin tools
Competitive bidding sharpens this process. Even if you intend to stay with your primary carrier, running a structured RFP forces transparency and routinely drives concessions. Business Solutions Group facilitates multi-carrier RFP processes using eProcurement technology that creates a standardized comparison across carriers — keeping incumbents competitive without damaging primary carrier relationships.
Optimize Your Carrier Mix, Contracts, and Service Terms
Building a Strategic Carrier Mix
Single-carrier dependency is both a cost and a risk problem. An analysis of over 20 million parcels by ePost Global found that multi-carrier networks achieved delivery speeds up to 37% faster on international routes, while also providing flexibility during peak-season capacity constraints.
Different carriers perform differently by zone, weight class, service level, and geography. Routing shipments to the carrier best suited for each use case — rather than defaulting to one for everything — reduces both cost and operational risk.
December 2024 on-time performance data illustrates the stakes:
| Carrier | Ground On-Time Rate |
|---|---|
| UPS Ground | 96.5% |
| FedEx Ground | 91.8% |
| USPS Ground Advantage | 90.4% |
A nearly 5-point gap between UPS and FedEx Ground during peak season means that a cheaper base rate from an underperforming carrier can cost more in service failures, customer chargebacks, and reshipments than any rate savings recovered.
What a Well-Structured Contract Actually Looks Like
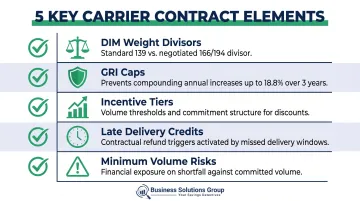
Beyond base rate discounts, these contract elements often determine the real cost of a carrier agreement:
- DIM weight divisors — retail standard is 139; high-volume shippers can often negotiate 166 or 194, significantly reducing DIM weight charges
- GRI caps — without them, consecutive 5.9% annual increases compound to roughly 18.8% over three years
- Incentive tiers — understand volume thresholds and structure commitments to maximize tier benefits
- Late delivery credit provisions — carriers rarely volunteer refunds without contractual triggers
- Minimum volume commitment risks — understand the financial exposure if shipping volumes shift
Service Level Alignment and Contract Timing
Map each shipment type to its cost-optimal service level. Defaulting to a single service across all order types is one of the fastest ways to overspend. Common mappings to evaluate:
- B2B regional shipments → ground or regional carrier services
- B2C e-commerce orders → zone-skipping or last-mile optimized networks
- Time-sensitive freight → express or guaranteed delivery tiers
- Standard non-urgent freight → economy or deferred options
Plan to review carrier agreements at least every 18 months — sooner if your volume has grown or you've hit minimum annual revenue commitment thresholds. Set internal calendar triggers well before contract expiration. Auto-renewals at current terms are rarely in your favor, and adequate lead time for analysis and benchmarking is what separates a reactive renewal from better contract terms.
Leverage Technology and Expert Advisory for Continuous Improvement
Carrier rate optimization fails when treated as an annual event. The shippers who sustain savings over time are the ones who build continuous monitoring into their operations.
Two Complementary Tools
Spend intelligence technology handles the ongoing analytical work: invoice auditing, anomaly flagging, carrier performance tracking, mode comparisons, and cost allocation by department or lane. Business Solutions Group's proprietary parcel spend intelligence platform converts raw shipping data into actionable dashboards — letting teams identify cost category shifts, verify discount accuracy, and track service failures in real time without manual spreadsheet work.
Advisory services cover what software alone can't deliver: market context, negotiation experience, and strategic judgment. BSG's advisory team includes former UPS and FedEx senior-level pricing analysts who benchmark client rates against real market data, model contract scenarios, and manage negotiations directly — operating on a coach-and-counsel model that requires minimal time from internal teams.
Nucleus Research found that TMS adoption can reduce transportation costs by 15%, with demurrage costs falling 47% and fuel usage dropping 12%. Third-party advisory engagements deliver comparable results: BSG clients average 23.6% savings through contract optimization, with outcomes ranging from 15% to 40% depending on baseline contract quality.
What Continuous Optimization Looks Like in Practice
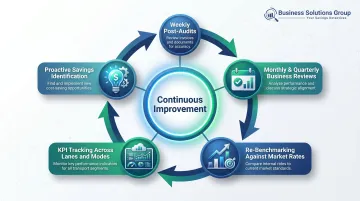
BSG's ongoing engagement model covers:
- Weekly post-audits of prior shipments
- Monthly or quarterly business reviews
- Re-benchmarking exercises against current market rates
- KPI tracking across lanes, modes, and carriers
- Proactive identification of new savings opportunities
The key difference from episodic renegotiation: the team stays engaged as market conditions shift, catching cost increases before they compound rather than discovering them at the next contract renewal.
Not all platforms and advisors deliver the same value. When evaluating partners, prioritize:
- Benchmark access against real (not published) market rates
- Scenario modeling for contract changes
- Proactive billing error recovery
- Actionable guidance — not just a reporting dashboard
Common Pitfalls to Avoid in Carrier Rate Optimization
Focusing Only on Base Rates
Carriers frequently offer attractive headline discounts while recovering margin through accessorial fees. A 20% base rate discount can be entirely offset by a 26.5% increase in additional handling surcharges — exactly the kind of structural change carriers have made in recent years. When stacked, DIM weight charges, additional handling, and residential surcharges can produce a final invoice three to four times higher than the base transportation rate.
Effective negotiations cover every line item: the rate card, accessorial schedule, minimum billable weights, and surcharge triggers — not just the headline discount.
Treating Contracts as Set-and-Forget
Multi-year agreements without GRI caps, performance review clauses, or renegotiation triggers are expensive over time. Three consecutive 5.9% GRIs compound to roughly 18.8% in base rate increases before a single surcharge is counted. Carriers also introduce structural changes mid-contract — ZIP code reclassifications, new minimum billable weights, redefined surcharge triggers — that don't appear in the headline GRI but inflate total spend measurably.
Build proactive contract management into your operations — quarterly performance reviews give you the leverage to address issues before renewal, not after.
Negotiating Without Data
Entering carrier negotiations without shipping profile data or market benchmarks hands carriers a significant advantage. They have full visibility into your account. Without benchmark comparisons, you have no objective basis to challenge what they propose.
Coming prepared means knowing, at minimum:
- Where you're paying above-market rates by service type and zone
- Which surcharge categories are inflating your effective rate
- How your profile compares to similar shippers in volume and mix
Shippers who arrive with this data routinely negotiate better outcomes — specific concessions backed by numbers, rather than general requests the carrier can easily deflect.
Frequently Asked Questions
How do you optimize transportation costs?
Optimization starts with auditing current spend to establish a true cost baseline, then benchmarking your rates against real market data. From there, negotiate better carrier contracts, optimize carrier selection based on performance and cost, and use technology to monitor and sustain savings on an ongoing basis.
What is the formula for shipping costs?
Shipping cost = Base Rate + Fuel Surcharge + Accessorial Fees (residential, DIM weight, address correction, delivery area, additional handling) + Zone or distance adjustments. Understanding each component separately is what makes targeted negotiation possible.
What are the four pillars of cost optimization?
In a carrier context: spend visibility, process efficiency, carrier leverage, and continuous improvement. Each pillar builds on the last — from auditing invoices and benchmarking rates, to routing optimization, competitive bidding, and ongoing performance monitoring.
What is carrier optimal routing?
Carrier optimal routing matches each shipment to the most cost-effective carrier and delivery path. It uses delivery zone, weight, service level, transit time, and carrier performance data to make that routing decision automatically and consistently.
What is transportation optimization used for?
Transportation optimization reduces freight and parcel shipping costs, improves delivery reliability, eliminates waste in carrier selection and routing, and builds a more resilient supply chain. It addresses both cost and service risk simultaneously.
What does carrier rate mean?
A carrier rate is the price charged to move a shipment: a base rate driven by weight, dimensions, zone, and service level, plus surcharges and accessorial fees on top. That base rate is rarely the final number on your invoice.