
The short answer: yes, you should benchmark your shipping freight rates. Without that data, there's no way to verify whether your rates are competitive or quietly inflated. U.S. business logistics costs totaled $2.6 trillion in 2024, equal to 8.7% of GDP — meaning even small percentage variances from market rates translate into significant dollar amounts at the company level.
This guide covers what freight rate benchmarking is, why it matters, which metrics to track, how to do it step by step, and how often to revisit it.
Key Takeaways
- Benchmarking compares what you pay carriers against current market rates for the same shipments and lanes
- Without it, overpayment is common and nearly invisible: carriers negotiate rates individually with each shipper
- Track cost per shipment, on-time performance, fuel surcharges, and accessorial charges separately
- Both small parcel and freight shippers benefit, regardless of volume
- Annual reviews are no longer enough — semi-annual benchmarking with ongoing spot-checks catches rate drift before it compounds
What Is Freight Rate Benchmarking?
Freight rate benchmarking is the systematic process of comparing your actual shipping rates — what you pay carriers — against current market rates for the same trade lanes, modes, weight breaks, and service levels.
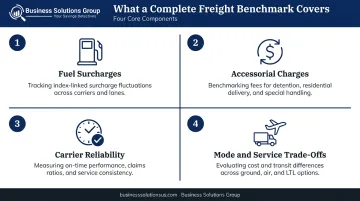
It covers more than just the base rate. A complete benchmark examines:
- Fuel surcharges — updated weekly by carriers like UPS, FedEx, XPO, and Old Dominion based on EIA diesel price indices; this cost can shift substantially between contract reviews
- Accessorial charges — residential delivery, liftgate, dimensional weight, address corrections, and delivery area surcharges
- Carrier reliability — on-time delivery performance against quoted transit times
- Mode and service trade-offs — cost and speed differences across ground, express, LTL, FTL, and parcel options
Benchmarking applies to any business that ships goods: small parcel (UPS, FedEx), LTL, FTL, and ocean freight. It's not a tool reserved for high-volume shippers. Carriers negotiate rates individually with every customer, which means businesses of any size can — and do — end up paying above-market rates.
Why You Should Benchmark Your Shipping Freight Rates
Confirm Whether Your Rates Are Actually Competitive
Every carrier contract is unique. Your rates were negotiated based on the data and leverage available at that moment — which may have been limited. Without benchmarking data, there's no reference point for whether your contract reflects market conditions or simply what the carrier was willing to offer.
The burden of verification falls on the shipper. Carriers don't proactively flag when your rates drift above market.
Strengthen Your Carrier Negotiation Position
Benchmark data changes the dynamic of a carrier negotiation. Instead of asking for better rates based on relationship or volume, you're presenting specific evidence: market rates for specific lanes, service levels, and weight breaks.
Research published in the International Journal of Logistics Management confirms that benchmarking freight rates helps shippers establish a negotiation yardstick for procuring cost-attractive transportation services. Industry commentary from FreightWaves estimates that technology-enabled, data-backed procurement can reduce full truckload freight spend by 2% to 3% and reduce spot-market exposure by 10% to 25%.
Identify Hidden Costs and Billing Errors
Benchmarking doesn't just compare contract rates — it often surfaces errors that have been compounding undetected.
According to Intelligent Audit, freight invoice error rates run between 5% and 8%. Logistics Management reports that outsourcing freight audit and payment can typically recover 3% to 7% of overall freight spend. These aren't rounding errors — on a $2M annual freight budget, that's $60,000 to $140,000 in recoverable spend.
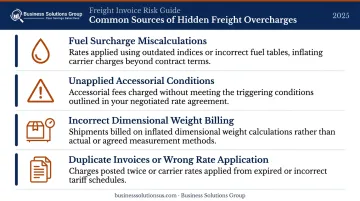
The most common sources of hidden overcharges include:
- Fuel surcharge miscalculations based on incorrect weight or zone
- Accessorial charges applied without triggering conditions
- Dimensional weight billing on packages that don't qualify
- Duplicate invoices or incorrect rate application
Improve Budget Forecasting and Cost Control
Freight markets move. The contract-to-spot spread in truckload swung from roughly 30% above spot in early 2022 to nearly 40% by spring 2023, then narrowed to about 8% later in 2024. Benchmark context turns unexplained budget variances into manageable, defensible line items — giving finance teams realistic variance bands to plan around.
Gain a Competitive Advantage Through Lower Logistics Costs
Businesses paying above-market freight rates carry structurally higher costs than competitors paying market rates. That gap either compresses margins or flows into higher product prices. Benchmarking gives you the data to close that gap — turning freight spend from a cost you accept into one you actively control.
Key Metrics to Track When Benchmarking Freight Rates
Cost Per Shipment / Cost Per Pound or Mile
This is the primary benchmark unit. Normalizing freight cost by weight, distance, or shipment unit allows direct comparison across carriers, lanes, and time periods.
How to calculate it:
- Cost per pound = total freight charge ÷ shipment weight
- Cost per mile = total freight charge ÷ origin-to-destination distance
- Cost per shipment = total all-in charge (base + fuel + accessorials) per package or pallet
Comparing these figures against market rates for equivalent lanes tells you immediately whether your current pricing is competitive — or leaving money on the table.
Carrier On-Time Delivery Rate
Cost metrics alone don't tell the full story. A carrier with competitive rates but poor reliability generates real downstream costs — expediting fees, customer service strain, and potential penalties from retail partners.
During the December 2025 peak shipping period, major domestic parcel carriers averaged 98% on-time delivery:
- UPS: 98.9%
- FedEx: 98.3%
- USPS: 97.2%
Use those figures as a baseline when evaluating your carriers' performance. For LTL, on-time benchmarks are typically score-based rather than percentage-based; Logistics Management's 2024 Quest for Quality ratings provide carrier-by-carrier comparisons.
Fuel Surcharge and Accessorial Rates
Fuel surcharges are updated weekly by major carriers, each tied to a different index:
- UPS Ground: EIA National U.S. Average On-Highway Diesel Fuel Price
- FedEx Ground: U.S. on-highway diesel
- XPO LTL: DOE/EIA weekly averages
These components can shift significantly between contract reviews — and carriers frequently recover revenue lost on discounted base rates through accessorial charges.
Benchmark these charges separately from base rates. A competitive headline rate paired with above-market fuel surcharges and accessorials can result in a total cost that's well above market.
Spot Rate vs. Contract Rate Spread
Contract rates are pre-negotiated lane-specific pricing. Spot rates are one-time market prices for individual shipments. When spot rates drop significantly below your contracted rate — as happened in late 2024 when the spread narrowed to roughly 8% — it signals an opportunity to renegotiate or introduce more flexible sourcing for select lanes.
Tracking this spread over time is one of the clearest indicators of whether your contract is in or out of market alignment.
How to Benchmark Your Shipping Freight Rates: A Step-by-Step Process
Step 1: Gather and Organize Your Shipping Data
Collect the following before starting any analysis:
- Carrier invoices (at least 6–12 months)
- Contract rate cards and accessorial schedules
- Shipment history segmented by lane, mode, weight class, and service level
- Any GRI (general rate increase) notices or amendments
Clean, complete data is the foundation. Incomplete shipment records produce misleading comparisons and understate the actual opportunity.
Step 2: Define the Scope of Your Benchmark
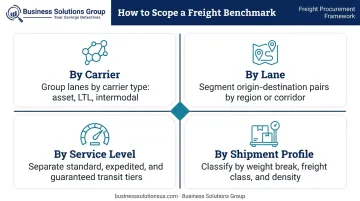
Benchmarking everything simultaneously produces noise. Segment the analysis:
- By carrier — evaluate each carrier's full rate structure independently
- By lane — group shipments by origin-destination pair
- By service level — ground, express, LTL, FTL separately
- By shipment profile — weight breaks, frequency, dimensions
Lane-by-lane analysis is more actionable than a global average. A $0.15/pound variance on a high-volume lane matters far more than the same variance on an occasional lane.
Step 3: Source Market Rate Data for Comparison
Reliable sources for benchmark rate data include:
| Source | Scope | Access |
|---|---|---|
| Cass Freight Index | North American freight, all modes | Public monthly |
| DAT Freight & Analytics | Truckload spot and contract, North America | Paid platform |
| Drewry World Container Index | Ocean container rates by major lane | Public weekly |
| U.S. Bank Freight Payment Index | Domestic freight payment trends | Public quarterly |
Third-party advisory firms and supply chain consultants with proprietary rate databases provide the most current lane-specific comparisons. This is especially useful for LTL and parcel benchmarking, where publicly available data is less granular.
Step 4: Analyze the Gaps and Prioritize Opportunities
Compare your rates against market data and rank gaps by dollar impact:
- Identify lanes or charge categories where your rates are significantly above market
- Calculate the annualized dollar value of each gap (rate variance × shipment volume)
- Prioritize high-volume lanes with large variances since these represent the most immediate savings potential
Gap analysis often reveals the most savings in places internal teams overlook: accessorial charges and fuel surcharge programs. A supply chain advisory partner like Business Solutions Group can run this analysis against proprietary spend intelligence data, surfacing variances that standard internal reviews typically miss.
Step 5: Use Findings to Negotiate or Re-Bid Contracts
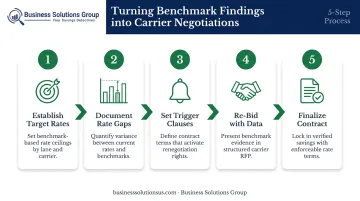
Benchmark findings should translate directly into a structured negotiation brief:
- Establish target rates per lane based on market data
- Document current rate vs. market rate for each line item you're challenging
- Set contractual trigger clauses that require review if market rates shift significantly
- Re-bid freight contracts with benchmark data in hand ; without it, carriers have little incentive to move on pricing
How Often Should You Benchmark Your Freight Rates?
Annual contract reviews are no longer adequate. The freight market doesn't move on a 12-month cycle.
Consider the volatility: the spot-contract spread moved from roughly 30% above spot in early 2022 to nearly 40% in spring 2023, then collapsed to around 8% in late 2024. Fuel surcharge components update weekly. Carrier network restructuring, mergers, and capacity shifts can affect your rates at any time.
Best practice for active shippers: formal benchmark review at least semi-annually, with ongoing monitoring of high-volume lanes.
Conduct an off-cycle benchmark immediately when:
- A carrier proposes a rate increase
- Your shipping volume or lane mix changes significantly
- A carrier undergoes a merger, acquisition, or network restructuring
- Freight spend is running materially above budget with no clear explanation
Each of these is a signal that your rates have drifted out of market alignment. When that happens, the right response is a targeted benchmark — not a full contract renegotiation, but enough data to know where you stand and what to ask for.
Frequently Asked Questions
What is the difference between freight benchmarking and a freight audit?
A freight audit reviews completed invoices for billing errors and overcharges on shipments already paid. Benchmarking compares your contracted rates to current market rates to assess whether your agreements are competitive. Both are valuable: audits catch billing mistakes, benchmarking catches systematic overpayment.
Can small businesses benefit from freight rate benchmarking?
Yes. Carriers negotiate rates individually with every shipper regardless of volume, which means smaller shippers frequently pay above-market rates by default. Limited negotiating experience and infrequent contract reviews make smaller businesses particularly vulnerable to rate drift.
How do I know if my current freight rates are too high?
Without benchmark data, you can't know. Warning signs include carrier-proposed rate increases that go unchallenged, contracts that haven't been re-bid in more than two years, or freight spend increasing faster than your shipping volume.
What is the difference between spot rates and contract rates in benchmarking?
Contract rates are pre-negotiated, lane-specific prices locked into a carrier agreement. Spot rates are one-time market prices for individual shipments. Tracking the spread between the two helps identify when contracted rates have drifted above market or when opportunistic spot buying makes sense.
Do accessorial charges need to be benchmarked separately from base rates?
Yes — always. Carriers routinely offset competitive base rates with above-market surcharges for fuel, residential delivery, address corrections, and dimensional weight. Benchmarking base rates alone understates total cost and misses a common source of overpayment.
How long does a freight rate benchmarking analysis take?
A focused single-carrier or single-lane review can be completed in days. A comprehensive multi-carrier, multi-mode analysis typically takes two to four weeks. Working with an experienced advisory firm that maintains existing rate databases and structured analysis frameworks shortens the timeline considerably.