Introduction
U.S. business logistics costs hit $2.58 trillion in 2024, according to the CSCMP/Kearney 36th Annual State of Logistics Report — yet most companies have no reliable way to know whether they're paying a fair price for freight. Transportation typically ranks among the largest controllable expenses for shippers, but without a reference point, overpayment is invisible.
Carrier pricing is deliberately complex, annual rate increases compound quietly, and accessorial fees accumulate in ways most businesses never scrutinize. Companies often absorb 5–6% General Rate Increases year after year without realizing they had negotiating room they never used.
Transportation cost benchmarking solves this by comparing your shipping rates, carrier performance, and overall logistics spend against market standards, so you can see exactly where you stand.
This guide covers:
- What transportation cost benchmarking is and why it matters
- The key metrics that drive meaningful comparisons
- A four-phase process for doing it right
- How to identify and avoid biased data sources
- Best practices for making benchmarking an ongoing discipline
Key Takeaways
- Benchmarking measures your freight rates and carrier performance against market standards to identify overpayment
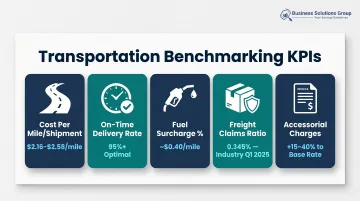
- Key metrics: cost per mile/shipment, on-time delivery rate, fuel surcharge percentage, freight claims ratio, and accessorial charges
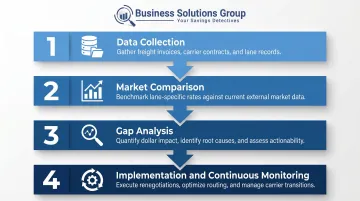
- Four-phase process: data collection, market comparison, gap analysis, and implementation
- Benchmark data quality depends entirely on source methodology — verify provider independence before acting on results
- Continuous monitoring (not annual reviews) is the standard for companies that consistently reduce transportation spend
What Is Transportation Cost Benchmarking?
Transportation cost benchmarking is the systematic process of comparing a company's shipping rates, carrier service levels, and logistics efficiency against industry standards, peer companies, or market averages. It applies across all freight modes — parcel, LTL, FTL, air, and ocean.
Internal vs. External Benchmarking
These two approaches serve different purposes:
- Internal benchmarking compares performance across your own business units, lanes, or time periods. It's useful for spotting internal inconsistencies — why does one region cost more per shipment than another? — but it can't tell you whether your rates are competitive against the broader market.
- External benchmarking measures your costs against market indices, industry reports, or third-party analytics platforms. This is where the real negotiating intelligence comes from.
Most effective benchmarking programs use both. Internal data reveals the patterns — external data tells you whether those patterns are costing you money.
Benchmarking vs. Market Intelligence
These terms are often used interchangeably, but they're different tools. Here's the practical distinction:
- Benchmarking shows how your current costs stack up against the market — it's a snapshot that drives contract negotiations and identifies overpayment.
- Market intelligence tracks where rates are heading, which shapes timing and procurement strategy.
Leading supply chain teams use both. Neither replaces the other.
Why Transportation Cost Benchmarking Matters for Your Bottom Line
Without benchmarking, costs like accessorial fees, detention charges, inefficient lane routing, and fuel surcharge miscalculations accumulate quietly in freight invoices that most finance teams lack the tools to audit.
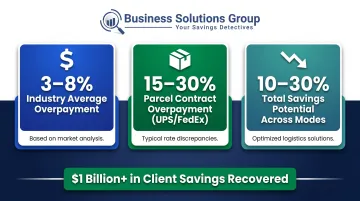
Industry data shows companies typically discover they are overpaying 3% to 8% of total freight spend once comprehensive audit systems are in place. For a company spending $10 million annually on freight, that's $300,000 to $800,000 in recoverable costs.
Business Solutions Group's internal benchmarking data shows the gap is often larger than industry averages suggest. Most companies that haven't independently benchmarked their parcel contracts in the past two to three years are overpaying by 15–30% on UPS and FedEx spend alone. Across all transportation modes, BSG has helped clients recover more than $1 billion in collective savings.
Stronger Carrier Negotiations
Benchmarking shifts the negotiation dynamic. When you walk into a rate discussion knowing the market rate for a specific lane, mode, and distance band, you're negotiating with data instead of assumptions.
Lane-level rate benchmarking can reveal 15% to 30% cost gaps hidden within national averages. A shipper relying only on a blended national benchmark might miss that their Midwest dry van lanes are significantly above market, while their Southeast lanes are priced competitively. Lane-specific data lets you direct renegotiation efforts where they'll have the biggest impact.
Identifying Underperforming Lanes and Carriers
Not every cost problem is a carrier pricing problem. Benchmarking across lanes reveals whether an above-market cost stems from:
- Carrier pricing on a specific corridor
- Route structure inefficiencies (wrong mode, inefficient stop sequencing)
- Market conditions that affect all carriers on that lane
This distinction matters. Renegotiating a carrier rate won't fix a routing problem, and blaming a carrier for market-driven costs creates unnecessary friction.
Risk Mitigation and Competitive Advantage
Benchmarking also functions as an early warning system. When contracted rates drift above market, or when a carrier's reliability declines relative to alternatives, continuous monitoring catches the problem before it costs you.
On the competitive side, businesses with real-time benchmark visibility can identify mode-shift opportunities as they emerge. BSG's analytics regularly identify when shifting freight from LTL to FTL, or from parcel to LTL, produces measurable cost reductions. Most companies that undergo a thorough benchmark analysis uncover 10–30% in savings potential, with a substantial share coming from mode optimization rather than rate changes alone.
Key Metrics and KPIs to Benchmark in Transportation Costs
Cost Per Mile, Per Shipment, and Per Unit Weight
These are the foundational cost metrics for any benchmarking program. Comparing them against industry averages by mode and lane length shows whether your base rates are competitive.
For context, the average total truckload operating cost in 2024 was $2.26 per mile (including fuel), per ATRI's 2025 operational cost survey. DAT's national average dry van contract rate sits around $2.16 per mile, while spot rates have climbed to approximately $2.52–$2.58 per mile entering 2026.
These figures set the baseline. If your negotiated rates sit significantly above contract-market levels, that's a clear benchmarking signal.
On-Time Delivery Rate and Transit Time
Service performance benchmarks matter as much as cost benchmarks. A carrier offering below-market rates but poor reliability creates hidden costs — retailer chargebacks, inventory safety stock, and customer service overhead that rarely show up in the freight budget.
The average LTL on-time delivery rate was 82% in 2024, meaning roughly one in six LTL shipments arrived late. An on-time delivery rate of 95% or higher is considered the optimal benchmark across freight modes. If your primary LTL carrier is running below 90%, you're absorbing service costs that aren't reflected in their base rate.
Fuel Surcharge Percentage
Fuel surcharges are variable, complex, and frequently miscalculated. Most carriers tie surcharges to the U.S. EIA weekly national average diesel price, but formulas differ by carrier. Monthly average van fuel surcharges ran approximately $0.40 per mile through most of 2025. Some LTL carriers have set surcharges as high as 46–49%.
Benchmarking fuel surcharge programs against published DOE indices helps identify overcharges and supports contract standardization.
Freight Claims Ratio
The freight claims ratio (the percentage of shipments resulting in damage or loss) directly affects total transportation cost, even when base rates look favorable. The average LTL damage rate was 1.24% of shipments in 2024, with an average cost per claim of approximately $1,796. Industry-wide, LTL freight claims cost shippers an estimated $2.4 billion annually.
The Synchro LTL Claims Index shows an industry claims ratio of 0.345% in Q1 2025, down from 0.588% in Q1 2020 — an improvement, but still a significant cost driver worth tracking by carrier.
Accessorial Charges
Accessorial charges are among the most commonly overpaid costs in freight. They typically add 15% to 40% on top of the base LTL rate. A $300 base rate often invoices at $475–$525 after liftgate, residential delivery, and fuel accessorials are applied.
Benchmarking accessorial rates against market norms and your own contract terms is where BSG's spend intelligence software most frequently surfaces hidden overcharges : misapplied detention fees, residential surcharges on commercial deliveries, and dimensional weight errors that carriers won't flag proactively.
The 4-Phase Transportation Cost Benchmarking Process
Phase 1: Data Collection
Effective benchmarking starts with comprehensive internal data:
- Freight invoices (12 months minimum)
- Carrier contract terms and rate schedules
- Shipment-level cost records by lane, mode, and weight break
- Transit time and on-time delivery history
- Accessorial charge history by type and carrier
Data quality here determines everything downstream. Incomplete or siloed data — freight invoices in one system, carrier contracts in another, service metrics in a spreadsheet — leads to incomplete conclusions. Capturing 6–12 months of shipment-level detail gives enough volume to surface statistically meaningful patterns.
Phase 2: Market Comparison
Internal data is compared against external benchmarks by lane and mode — not just high-level national averages. Useful sources include:
| Source | What It Provides |
|---|---|
| DAT RateView | Spot and contract TL rates by lane, updated continuously from $150B+ in transactions |
| Cass Freight Index | Monthly North American freight expenditure trends from $50B+ in processed transactions |
| CSCMP State of Logistics Report | Annual macro benchmarks for total U.S. logistics spend |
| FreightWaves SONAR | Real-time capacity and tender data for market timing |
| FMIC | Regression-based truckload benchmarks from 130+ shippers and 30M+ transactions |
Lane-specific comparison is essential. A benchmark that shows your costs are "at market" nationally may mask that you're 20% above market on your three highest-volume corridors.
Phase 3: Gap Analysis
This phase identifies the difference between current performance and market benchmarks across cost, service, and efficiency metrics. Gaps should be prioritized by:
- Dollar impact — which gaps represent the largest financial opportunity?
- Root cause — is this a carrier pricing issue, a route structure problem, or a market condition?
- Actionability — what changes would close the gap, and how disruptive are they?
Business Solutions Group's spend intelligence platform handles much of this analysis automatically. It surfaces accessorial overcharges, above-market lane rates, fuel surcharge discrepancies, and billing errors across your invoice history — no manual line-item review required.
The platform manages over $3 billion in parcel spend and includes 25+ built-in insights that flag issues carriers don't surface in standard reporting.
Phase 4: Implementation and Continuous Monitoring
Once gaps are identified and prioritized, findings translate into specific actions:
- Renegotiating carrier contracts on identified lanes
- Restructuring routing guides to reflect current market rates
- Consolidating shipments to improve weight utilization
- Switching carriers on specific lanes where alternatives offer better value
Markets don't hold still after implementation. Major LTL carriers announced General Rate Increases of 4.9% to 5.9% for 2026, and dry van spot rates climbed approximately 8.2% year-over-year entering 2026. A contract that was competitive when signed may not be six months later.
How to Avoid Biased Benchmarking
Not all benchmark data is created equal. MIT researcher Chris Caplice, writing for DAT, identifies three questions every shipper should ask of any benchmarking source:
- How is the benchmark calculated? Methodology should be transparent and documented.
- Where does the data come from? Breadth, representativeness, and recency all matter.
- What are the provider's goals? A provider who also brokers freight or sells carrier contracts has a structural incentive to skew results.
Each question points to a different failure mode. The sections below break down the two most common ones.
Watch for Narrow Datasets
A benchmark drawn from a single industry segment, geography, or shipper size won't reflect the broader market. A tool built primarily from industrial shipper data might show rates declining while retail and CPG sectors are simultaneously tightening. Reliable benchmarks draw from across:
- Multiple shipper sizes (small, mid-market, enterprise)
- Diverse industries and commodity types
- Varied lane types (spot, contract, regional, long-haul)
The Self-Evaluation Problem
If your logistics provider manages your freight and supplies the benchmarks used to evaluate their performance, there's no independent standard. This is the most common form of benchmark bias, and it's frequently unintentional — the provider genuinely believes their data is accurate. For any evaluation that affects carrier selection or contract terms, use a third-party or neutral benchmarking source.
Best Practices for Ongoing Benchmarking Success
Move from Annual to Continuous
The traditional annual RFP cycle made sense when freight markets moved slowly. They don't anymore. LTL GRIs announced in late 2025 took effect in early 2026. Spot market rates shifted 8% in a single year. A contract locked in January may be above market by July.
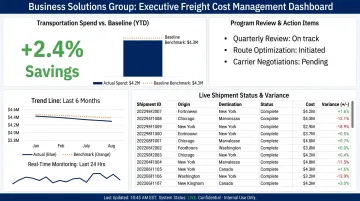
Quarterly reviews are a reasonable minimum for most shippers. High-volume lanes warrant real-time monitoring. Business Solutions Group delivers this through executive dashboards showing live performance versus baseline, plus weekly, monthly, and quarterly program management reviews — so clients see rate drift before it compounds.
Use Technology to Remove Manual Bottlenecks
Only 35% of shipping firms currently use a Transportation Management System, yet effective TMS deployment reduces freight expenses by approximately 8%. The barrier for most mid-market shippers is cost and implementation complexity.
For companies without in-house technical resources, that barrier is real. Business Solutions Group removes it by providing a full TMS at no additional cost as part of the engagement — a system that would otherwise run $150,000–$250,000 to implement independently. It handles automated routing, carrier tendering, and exception management, giving mid-market shippers enterprise-grade tools without the enterprise price tag.
That same TMS also runs automated invoice auditing — catching what manual review routinely misses. Wrong rates, misapplied discounts, duplicate charges, uncredited late deliveries, and erroneous accessorial fees all slip through paper-based processes. Industry estimates show 3% to 6% of freight invoices contain billing errors, with some pegging the figure as high as 8%.
Engage Broader Market Data Sources
No single provider dataset reflects the full market. Treating one carrier's data as the market standard is one of the most common benchmarking mistakes shippers make.
Broaden your comparison base by drawing from multiple sources:
- Freight data consortia — aggregate rate data across shippers and lanes
- DAT Solutions — spot and contract rate indices for truckload and LTL
- Cass Freight Index — monthly shipment and expenditure trends
- EIA diesel reports — fuel surcharge benchmarking inputs
- CSCMP State of Logistics Report — annual industry cost and performance benchmarks
Frequently Asked Questions
What is a freight cost benchmark?
A freight cost benchmark is a reference point — derived from market rates, industry data, or peer comparisons — used to evaluate whether your transportation costs are competitive or above market. It provides the external standard needed to assess carrier pricing objectively rather than in isolation.
What are the 4 phases of benchmarking?
The four phases are:
- Data collection — gather internal shipment and cost records
- Market comparison — compare against external lane-specific benchmarks
- Gap analysis — identify where performance deviates from market standards and why
- Implementation and monitoring — act on findings and track performance on an ongoing basis
What is an example of cost benchmarking?
A shipper compares its cost per mile on Midwest dry van lanes against DAT contract rate data and finds it's overpaying on three high-volume corridors. It then renegotiates those lanes while keeping existing carriers where pricing is already competitive.
How often should transportation costs be benchmarked?
Quarterly at minimum, with real-time monitoring on high-volume lanes. Annual benchmarking was standard when freight markets were stable, but LTL GRIs, fuel price swings, and capacity shifts now move fast enough that annual reviews leave money on the table for months at a time.
What KPIs matter most in transportation cost benchmarking?
The five most important are: cost per mile or shipment, on-time delivery rate, fuel surcharge percentage, freight claims ratio, and accessorial charges. Together, they cover both cost competitiveness and service quality.
Can small businesses benefit from transportation cost benchmarking?
Often more than large shippers. Small and mid-sized companies typically pay standard tariff rates rather than negotiated contracts and lack the volume to gauge whether rates are competitive. Business Solutions Group works with companies spending $500,000 or less annually on freight and parcel, offering a complimentary benchmark analysis at no cost or commitment.