Yet most businesses still manage that spend reactively—reconciling invoices after the fact, relying on fragmented reports, or trusting gut instinct over data. The result? Chronic overspending with no clear picture of why.
Transportation spend analytics changes that dynamic. It gives businesses the visibility to move from reactive cost management to deliberate, data-driven savings. This article covers what transportation spend analytics actually is, which metrics matter most, how to act on the insights it surfaces, and what technology makes it all work.
Key Takeaways
- Transportation spend analytics aggregates shipping data to show where costs are high, why, and how to fix them.
- The most valuable KPIs are cost per shipment, accessorial spend, on-time delivery rate, and invoice accuracy rate.
- Biggest cost-reduction wins come from carrier optimization, mode shifting, accessorial fee prevention, and data-backed contract negotiations.
- The right platform centralizes carrier and mode data, automates reporting, and surfaces actionable insights.
- Analytics is an ongoing discipline—not a one-time audit. Sustained savings require sustained tracking.
What Is Transportation Spend Analytics?
Transportation spend analytics (TSA) is the systematic collection, normalization, and analysis of all transportation cost data—across carriers, lanes, modes, and time periods—to identify inefficiencies, validate invoices, and support strategic logistics decisions.
Invoice review tells you what you paid. TSA goes further — connecting spending patterns, carrier behavior, and operational decisions to explain the cause of those costs and where to reduce them.
What Data It Covers
A complete TSA program pulls from multiple sources:
- Freight invoices and freight bills
- Carrier contracts and rate sheets
- TMS shipment records
- Audit and payment reports
- Carrier performance data (on-time delivery, service failures, claims)
- Accessorial charge breakdowns by fee type and carrier
The depth of insight depends entirely on data completeness. A program drawing from all these sources will surface patterns that invoice-only analysis will never catch.
What TSA Is Not
TSA is not a freight auditing tool—though auditing is one component of it. Freight auditing looks backward to recover overcharges. Transportation spend analytics uses historical data to look forward: anticipating cost increases, benchmarking carrier performance against market norms, and enabling proactive adjustments before problems compound.
In practice, that means identifying a rate anomaly before it compounds across 500 shipments—not reconciling it after the fact.
Where Transportation Budgets Bleed: The Hidden Cost Problem
Transportation's share of total logistics spend makes it the highest-leverage target for cost reduction. But most companies lack real-time visibility into how that money is actually being allocated—which means overspending often goes undetected until it shows up as a budget overrun.
Three categories of costs are most commonly untracked:
Accessorial Fees
Charges for residential delivery, liftgates, detention, fuel surcharges, and address corrections quietly inflate invoices. Fuel surcharges alone can add 15% to 30% to LTL base charges, and carriers adjust them weekly—making net-effective rates a moving target that base-rate analysis completely misses.
Billing Errors
Carrier invoices regularly contain overcharges, duplicate charges, misapplied rates, or unauthorized fees. Freight audit specialists report recoveries of 1% to 9% of invoice value through systematic audit and dispute programs. For companies with significant freight spend, a company spending $5M annually could recover $50,000–$450,000 in overcharges. Those errors recur until someone catches them.
Inefficient Modal and Lane Decisions
Shipping via air or expedited ground when standard ground would meet the delivery window. Routing through high-cost lanes when lower-cost alternatives exist. Moving LTL when volume would support consolidation into truckload. Without data, these decisions get made on habit or convenience rather than cost-efficiency.
Each of these gaps compounds the others. Budget overruns surprise finance teams, carrier accountability becomes impossible to enforce, and negotiating leverage disappears. Carriers have detailed knowledge of each shipper's volume and routing profile when they set pricing. Shippers without equivalent data on their own spend are at a structural disadvantage before a rate conversation even starts.
Key Metrics and KPIs Every Shipper Should Track
Not all data points are equally useful. Tracking too many metrics creates noise. The goal is a targeted set of KPIs that directly reveal where costs are excessive, where performance is falling short, and where negotiating leverage exists.
Cost Metrics
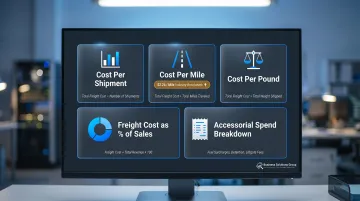
Cost per shipment is the foundational baseline: total freight spend divided by number of shipments in a given period. Track it over time and by carrier to reveal cost drift. Pair it with these supporting metrics:
- Cost per mile — enables cross-carrier and cross-lane comparisons (the ATRI reports the average U.S. trucking cost was $2.260 per mile in 2024, a reliable industry benchmark)
- Cost per pound — normalizes comparisons across shipment sizes
- Freight cost as a percentage of total sales — connects logistics performance directly to margin impact
Accessorial spend deserves its own tracking category. Break out detention, fuel surcharges, residential delivery fees, and address correction charges from base rates. These are where hidden inflation accumulates, and separating them from base rates exposes patterns that can be fixed operationally or negotiated contractually.
Delivery and Performance Metrics
On-time delivery rate is the primary performance KPI — it reflects whether carriers are meeting service commitments and affects customer satisfaction directly. Track it alongside transit time variance (actual vs. expected delivery time) to identify which carriers and lanes have persistent reliability problems.
A carrier with low rates but chronic service failures often costs more than a reliable alternative once you factor in expedite charges and downstream customer impact.
Invoice Accuracy Metrics
Freight bill accuracy rate — the percentage of invoices billed correctly against contracted rates and actual services — creates a documented record of billing compliance. Tracked over time and by carrier, this metric gives shippers factual evidence for disputes, contract negotiations, and carrier performance reviews. Without it, billing errors recur silently.
From Data to Action: How to Cut Transportation Costs
Spend data only creates value when it changes behavior. These four areas show where transportation analytics consistently converts visibility into lower costs.
Carrier Optimization and Contract Negotiation
Carrier performance scorecards—built from on-time delivery rates, invoice accuracy, and service failure data—create a factual foundation for accountability conversations. When documented data shows consistent failures, shippers can demand SLA remedies or shift volume to better-performing carriers.
This data also becomes negotiating leverage. Shippers who enter contract renewals with their own spend profile, accessorial breakdowns, and benchmark comparisons are far better positioned than those relying on whatever the carrier presents.
Business Solutions Group's benchmark analysis service compares a shipper's current rates and discounts against what similar shippers are paying across the market, identifying where rates are above-market and building a fact-based case for better terms. For most companies, that analysis reveals 10–30% in actionable savings opportunities—without switching carriers.
Mode Shifting
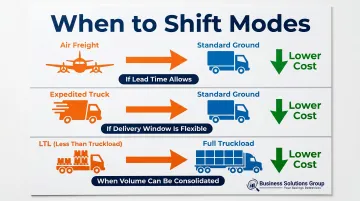
Analytics identifies shipments moving via premium modes where a cheaper alternative would meet the same service window. Common opportunities include:
- Air freight shipments that could move ground given adequate lead time
- Expedited ground moves that qualify for standard ground
- LTL volumes that, when consolidated, justify truckload rates
The key is setting a speed-vs.-cost threshold for each product category and lane—then using data to enforce it. Business Solutions Group's platform flags these opportunities directly, flagging when a shipper should move from parcel to LTL, LTL to FTL, or air to ocean based on shipment patterns and cost differentials.
Accessorial Fee Prevention
Once accessorial patterns are visible, the root causes become actionable. Common fixes:
- Adjust warehouse scheduling to reduce detention charges
- Implement address validation to eliminate correction fees
- Revise delivery preferences to reduce residential surcharges
- Negotiate fuel surcharge caps during contract renewals
Preventing a fee from occurring beats disputing it after invoices arrive. Business Solutions Group targets fuel surcharges, liftgate fees, reclassifications, and detention during carrier negotiations—where the leverage actually exists.
Budget Forecasting with Historical Data
Historical spend trends by lane, carrier, mode, and season enable more accurate freight budgeting. Predictive analytics can model the cost impact of volume changes, carrier rate increases, or network adjustments before they happen—moving budget planning from reactive catch-up to confident forward projection. When cost overruns emerge, they appear in the data early enough to respond.
Specifically, historical data supports:
- Lane-level cost projections for annual budget cycles
- Scenario modeling when volumes or carrier rates shift
- Early warning flags when spend trends off-course mid-year
The Technology Behind Transportation Spend Analytics
Centralized Data and Automated Reporting
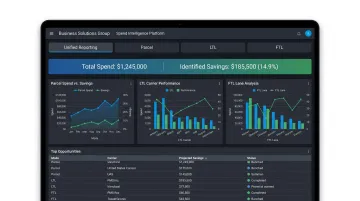
A dedicated analytics platform serves as the central hub—ingesting data from carrier invoices, TMS, ERP, and WMS systems into one normalized source. This eliminates data silos and replaces manual spreadsheet reconciliation with automated, always-current dashboards.
Business Solutions Group's spend intelligence platform builds on this principle directly, breaking down disconnected systems by integrating parcel, LTL, and FTL data into one unified reporting structure. The result is that leadership, finance, and operations teams can make decisions in real time rather than waiting for monthly reports.
The platform manages over $3 billion in parcel spend and has helped clients achieve more than $350 million in annual savings—figures that reflect consistent, systematic application rather than one-time audits.
AI and Predictive Capabilities
Beyond backward-looking reports, advanced platforms incorporate predictive analytics: forecasting future spend based on shipping patterns, modeling the impact of network changes, and identifying cost-driving trends before they compound. The platform also provides cost analytics comparing actual versus projected spend to surface overcharges as they emerge—not 60 days later.
McKinsey estimates AI can create $1.3 to $2.0 trillion in annual value across supply chains, with much of that potential concentrated in anomaly detection and forecasting—the two functions where freight cost leakage is most preventable.
What Integration Actually Requires
An analytics platform is only as powerful as the data it can access. The right solution needs to connect across:
- Parcel carriers: UPS, FedEx, DHL, and regional carriers
- Freight modes: LTL, truckload, air, ocean, and rail
- Existing systems: TMS and ERP platforms via API
API compatibility is what determines whether the platform produces live intelligence or just historical snapshots.
Without that connectivity, even the best analytics engine is working with incomplete information—and incomplete data produces decisions you can't fully trust.
Frequently Asked Questions
What is transport analytics?
Transport analytics collects and analyzes transportation data—invoices, shipment records, carrier performance—to identify where logistics costs originate and where efficiencies can be gained. It applies across all modes, including parcel, LTL, and truckload.
How do you analyze freight costs?
Consolidate carrier invoices, shipment records, and contract data into a single platform, then break spend down by carrier, lane, mode, and charge type. Comparing actuals to contracted rates and market benchmarks surfaces overcharges, inefficiencies, and savings opportunities.
What are the most important KPIs for managing transportation spend?
The core KPIs are cost per shipment, freight cost as a percentage of total sales, on-time delivery rate, accessorial spend by charge type, and invoice accuracy rate. Track these by carrier over time for the most actionable insights.
How does transportation spend analytics help during carrier negotiations?
Analytics gives shippers documented evidence—performance data, billing inaccuracies, and market benchmarks—rather than assumptions going into negotiations. Carriers are far more likely to offer concessions on rates, discounts, and incentives when faced with specific, data-backed comparisons.
What data sources do I need to start analyzing my freight spend?
The foundational sources are carrier invoices, freight bills, TMS shipment records, carrier contracts and rate sheets, and audit or payment reports. Consistent capture and integration of these into a single platform is what makes the analysis actionable.