Transportation costs reached $1.51 trillion in 2024 — roughly 63.7% of total U.S. logistics spend. For most businesses, freight isn't a rounding error. It's a profit lever hiding in plain sight.
This guide walks through a practical, step-by-step approach to balancing freight costs and service quality — covering the key variables, the most common mistakes, and how to diagnose the strategy when it stops working.
Key Takeaways
- Match carrier, mode, and contract terms to each shipment's specific requirements — not a one-size-fits-all approach
- Run a freight spend audit first to establish a measurable baseline before any optimization
- Segment shipments by service criticality; Tier 1 and Tier 3 lanes require different cost strategies
- Mode shifts, consolidation, and contract renegotiation deliver the biggest spend reductions without cutting service
- Sustain the balance through ongoing carrier KPI tracking and regular invoice auditing
How to Balance Freight Costs and Service: Step-by-Step
Step 1: Audit Your Current Freight Spend and Establish a Baseline
Before any cost or service decision can be made intelligently, you need a clear picture of what you're spending — on which lanes, with which carriers, and at what service levels. That clarity starts with a structured freight spend audit.
A freight spend audit involves:
- Pulling invoice data across all modes (parcel, LTL, TL, intermodal, air)
- Breaking down charges at the line-item level — base rates, fuel surcharges, accessorials, residential fees, dimensional weight charges
- Comparing billed amounts against contracted rates to identify discrepancies
The scale of the problem is larger than most assume. 22% of freight invoices contain errors requiring manual intervention, and billing errors typically cost shippers 3–7% of total freight spend annually. The five most common errors: incorrect dimensional weight calculations, duplicate invoices, missing contract discount codes, unauthorized accessorial charges, and rate misapplication.
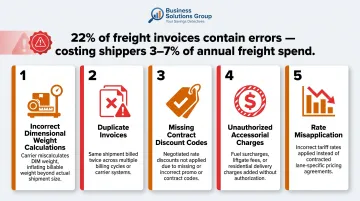
Catching errors before payment recovers close to 100% of the overcharge. Post-payment recovery typically yields only 60–80%.
Benchmarking matters at this stage. Knowing what you're spending is half the picture — knowing whether that spend reflects fair market pricing is the other half.
Business Solutions Group's freight spend audit captures 6–12 months of shipment data, then benchmarks current carrier pricing against market rates using proprietary spend intelligence software. The output: consolidated dashboards showing cost categories, carrier performance, and identified savings opportunities — before any commitment is required, at no cost.
Step 2: Segment Shipments by Service Criticality
Not every shipment carries the same stakes. A time-sensitive replenishment order for a major retail customer is not the same as an internal transfer with a two-week lead time — but many shippers treat them identically, either overpaying for service on low-priority freight or under-resourcing critical lanes.
Use a three-tier segmentation model:
| Tier | Characteristics | Cost Optimization Priority |
|---|---|---|
| Tier 1 | Customer-facing, SLA-bound, tight delivery windows | Protect service — minimize cost pressure |
| Tier 2 | Standard lead times, some schedule flexibility | Moderate — test rate improvements carefully |
| Tier 3 | Internal transfers, non-urgent, flexible timing | Aggressive — maximize cost efficiency |
This segmentation drives every downstream decision: carrier selection, mode choice, and where to concentrate negotiating energy. Cost-cutting pressure belongs on Tier 2 and Tier 3 freight. Tier 1 lanes are where service failures generate chargebacks (typically 1–3% of gross sales) and expedited recovery costs that quickly erase any rate savings achieved.
Step 3: Optimize Carrier Selection and Negotiate Contract Terms
Rate is not the only variable in carrier selection — and often not the most important one. A carrier that wins on price but delivers late, damages freight, or invoices incorrectly can cost far more than a slightly more expensive carrier with a clean track record.
Before awarding freight contracts, evaluate:
- On-time delivery rate by lane
- Damage and claims ratio (LTL industry average: 0.345% per the Synchro Claims Index in Q1 2025, down from 0.588% in Q1 2020)
- Billing accuracy and dispute resolution responsiveness
- Network coverage in your specific lanes
Best practices for contract negotiation:
- Run an annual bid process using consistent, standardized carrier disclosure packages
- Aggregate inbound, outbound, and third-party volumes to maximize negotiating leverage — volume fragmented across too many carriers weakens your position
- Build a right-sized core carrier group rather than spreading volume thin
- Define minimum performance standards (on-time rate, claims ratio, billing accuracy) as qualification criteria before awarding contracts
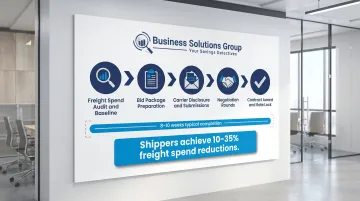
Shippers using structured bid and benchmarking processes consistently achieve 10–25% freight spend reductions. Business Solutions Group's carrier negotiation service runs the full process — from bid package preparation through face-to-face negotiation rounds to final contract award — typically completing in 8–10 weeks, with clients achieving savings of 15–35% on freight contracts. All contracts are negotiated in the client's name, so carrier relationships and pricing terms remain fully visible and owned by the client.
Step 4: Select the Right Mode for Each Lane
Mode selection is where the largest single-decision cost impact lives. Using air for freight that could move LTL inflates costs dramatically. Using LTL on lanes where truckload or intermodal is viable leaves efficiency on the table.
Key conversion opportunities:
- Truckload to intermodal on lanes over 500 miles: Q1 2026 intermodal spot savings averaged 30.6% versus truckload — nearly double the historical 16–19% average. On a per-ton basis, rail runs approximately $70/ton versus $215/ton for over-the-road trucking.
- LTL to volume LTL or shared truckload for mid-size shipments that consistently approach minimum truckload thresholds
- Zone skipping for high-frequency regional lanes — consolidating bulk shipments closer to destination zones can reduce shipping costs by up to 30%
The tradeoff is transit time. Intermodal adds 1–2 days versus truckload on most lanes, and consolidation strategies require lead time discipline. Run the service-criticality tier of each lane before making mode decisions.
Step 5: Monitor Performance and Adjust Continuously
The gains built in Steps 1–4 don't hold themselves. Without active monitoring, rate creep, routing guide violations, and carrier performance degradation steadily erode hard-won savings.
Track these carrier KPIs on a regular cadence:
- On-time delivery rate by lane and carrier
- Damage and claims rate
- Billing accuracy (measured against contracted rates)
- Routing guide compliance rate across shipping locations
Routing guides are particularly important. If the carrier and mode decisions made during negotiation aren't being executed at the shipment level, premiums accumulate fast — especially when individual locations default to premium services for convenience.
Business Solutions Group's TMS provides real-time shipment visibility, automated exception alerts, post-shipment invoice audit, and carrier performance trend analysis — keeping performance tracking active between formal review cycles, not just at quarterly check-ins.
When to Prioritize Cost vs. Service
This isn't a universal rule — it depends on what's moving, for whom, and when.
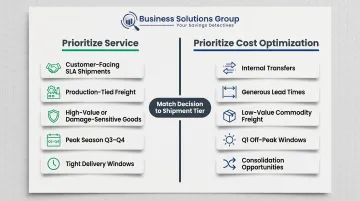
Prioritize service when:
- Shipments are customer-facing with contractual SLAs
- Freight is tied to production schedules where a delay cascades downstream
- Products are high-value or damage-sensitive
- It's peak season (Q3–Q4), when capacity tightens and service failures compound
Prioritize cost optimization when:
- Moving internal transfers or non-urgent replenishment
- Lead times are generous and delivery windows are flexible
- Freight is low-value commodity product
- Shipping during Q1 off-peak windows when spot capacity is abundant and rates soften
- Consolidation opportunities exist that don't compromise delivery commitments
The key is matching the decision to the shipment tier. Misapplying either logic — running peak-season service rules on a routine internal transfer, or applying cost-optimization logic to a customer SLA lane — creates avoidable costs or avoidable risk. Getting the tier right is where the balance actually happens.
Key Variables That Affect the Cost-Service Balance
Even with the right strategy in place, these variables can push costs up or erode service levels before the damage shows up in reporting.
Carrier Network Depth
A carrier that wins on rate but has thin coverage in specific lanes will fail during peak periods — forcing expensive spot market purchases that erase planned savings. Spot van rates surged to $2.29/mile in December 2025, nearly 9% higher year over year. Contracted carrier relationships provide cost stability precisely when spot market alternatives spike.
Fuel Surcharges and Accessorial Fees
Base rates rarely tell the full story. The fees layered on top — surcharges, accessorials, special handling — are where freight bills quietly expand. Key benchmarks to know:
- LTL accessorial charges averaged 8.7% of total LTL spend in 2023, with some shippers reaching 20%
- Fuel surcharges can account for 20–40% of the total LTL freight bill
- Residential delivery surcharges increased 114% between 2019–2023
- Overlength freight charges rose 123.3% over the same period
Negotiating caps or inclusions for common surcharges in carrier contracts is one of the most direct cost control levers available — yet most shippers never address it during contract renewals.
SLA Alignment
Beyond surcharges, misaligned SLAs are another consistent source of avoidable spend. When internal shipping standards are tighter than what customers actually require, businesses pay for faster service than anyone needs. Auditing actual delivery requirements against internal shipping standards frequently reveals that premium transit options are in use where standard service would satisfy the contract.
Common Mistakes That Throw Off Your Freight Balance
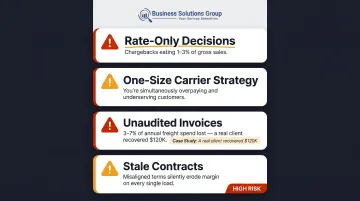
Rate-Only Decisions: Service failures generate chargebacks (1–3% of gross sales) and recovery shipping costs that routinely exceed the rate savings that triggered the carrier switch.
One-Size Carrier Strategy: One-size-fits-all approaches either overpay for service on low-priority lanes or underserve on critical ones — sometimes simultaneously.
Unaudited Invoices: With 22% of freight invoices containing errors and billing discrepancies totaling 3–7% of annual spend, systematic line-item review is essential. One AFS Logistics case documented a shipper that accumulated $120,000 in LTL accessorial overcharges before anyone caught it.
Stale Contracts: Carrier agreements that no longer reflect actual shipping volumes, lane patterns, or order profiles cost shippers on every load — and may lock them into terms that no longer fit their operations.
Troubleshooting: When Your Freight Strategy Stops Working
Problem 1: Freight Costs Keep Rising Despite Optimization Efforts
Likely cause: Accessorial and surcharge growth is outpacing base rate savings; routing guide compliance has slipped; or volume has shifted toward spot market carriers.
What to check: Run a line-item invoice audit to isolate where cost growth is occurring. Verify routing guide compliance across all shipping locations. Confirm that volume commitments to contracted carriers are being met — falling short of volume thresholds can trigger rate renegotiation provisions.
Problem 2: Service Failures Increase After Switching to Lower-Cost Carriers
Root cause: New carriers were selected on rate without adequate evaluation of on-time performance, network coverage, or peak-period capacity reliability.
Where to look: Pull carrier performance data by lane and review:
- On-time rate, damage claims, and transit time variability
- Tier placement against current carrier evaluation criteria
- Lane criticality to determine where service standards can't be compromised
Restore higher-performing carriers to Tier 1 lanes while keeping cost-optimized carriers on lower-criticality freight.
Problem 3: Transportation Budget Forecasting Is Consistently Inaccurate
Diagnosis: Budgets built on aggregate averages miss lane-level variability, and seasonal demand shifts, fuel surcharge volatility, and annual General Rate Increases (GRIs) aren't being factored in proactively. FedEx and UPS have announced 5.9% GRIs for three consecutive years (2024–2026), with specific surcharge categories climbing significantly higher — FedEx residential surcharge up 8.4%, Adult Signature Required up 15.6%.
Action steps: Shift to lane-level budget modeling using 12+ months of historical shipment data. Build contingency buffers for Q3–Q4 rate seasonality and fuel surcharge volatility. A logistics advisory partner with access to market benchmarking data can sharpen forecast accuracy, especially around seasonal cost spikes and carrier GRI impacts. Business Solutions Group's spend intelligence tools are built specifically for this kind of lane-level modeling.
Frequently Asked Questions
What is freight transport management?
Freight transport management covers planning, executing, and monitoring the movement of goods from origin to destination. It spans carrier selection, mode decisions, cost control, and service performance across all shipping modes — parcel, LTL, truckload, intermodal, and air.
What is the most expensive mode of freight transportation?
Air freight carries the highest cost per ton-mile of any mode. A shipment costing roughly $195 by ocean would cost approximately $1,000 by air — about a 5x multiple. Shippers typically avoid air unless urgency demands it, defaulting to LTL, truckload, or intermodal instead.
What is CFR and C&F in freight?
CFR (Cost and Freight) and C&F are terms for the same Incoterm: the seller covers freight costs to the destination port, but risk transfers to the buyer once goods are loaded onto the vessel — not upon arrival. Both terms apply only to sea and inland waterway transport.
How much does freight load balancing typically cost to implement?
Costs vary by company size, shipping volume, and whether you use a TMS platform, internal resources, or an advisory firm. Business Solutions Group's freight audit programs are performance-based — fees are tied to verified savings delivered, so the program is effectively self-funded through recovered spend.
What are the two types of load balancing in freight logistics?
The two primary forms are carrier load balancing — distributing shipment volume across a core carrier group to maintain negotiating leverage and avoid over-reliance on any single carrier — and geographic load balancing — routing freight through distribution points or consolidation hubs to minimize zone-based pricing and reduce transit distance.