Introduction: Why Gut Instinct Is No Longer Enough
Supply chain leaders are managing more complexity than ever. Freight costs rose 5.4% in 2024 to $2.58 trillion — roughly 8.8% of U.S. GDP. Tariffs are reshuffling trade routes. Nearly 80% of organizations experienced supply chain disruptions in the past 12 months, and major interruptions lasting a month or longer hit companies every 3.7 years on average.
The companies absorbing these shocks aren't necessarily bigger or better-resourced. They're better informed. They've built the infrastructure to convert raw supply chain data into decisions — not just reports.
Most businesses already generate enormous volumes of data across procurement, logistics, ERP, and warehouse systems. The gap is knowing how to act on it. Companies relying on lagging spreadsheets and gut instinct are outmaneuvered by those running predictive models and real-time dashboards.
This guide covers:
- The four types of advanced analytics and where each creates measurable value
- Business benefits companies are actually seeing across supply chain functions
- A practical implementation roadmap to get started
Key Takeaways
- Advanced analytics converts raw supply chain data into specific, executable decisions, not just backward-looking reports.
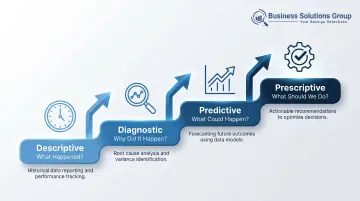
- The four types — descriptive, diagnostic, predictive, and prescriptive — each answer a progressively more strategic question.
- Highest-value applications include demand forecasting, inventory optimization, logistics cost reduction, and supplier risk management.
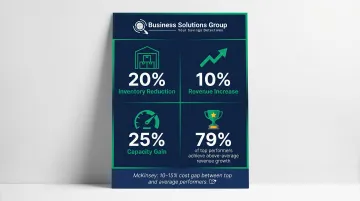
- McKinsey data shows top supply chains outperform average operators by 10–15% of total costs, with granular analysis driving 25%+ gains on specific variables.
- The main barriers — data silos, talent gaps, and change management — are addressable through phased implementation.
The Four Types of Advanced Analytics in Supply Chain
Most organizations have more supply chain data than they know what to do with. The four-type analytics model gives that data structure — each tier builds on the last, moving from historical insight to real-time decision support.
Descriptive Analytics: What Happened
Descriptive analytics uses historical supply chain data — shipment records, inventory levels, carrier performance, production throughput — to build dashboards and baseline reports. It answers one question: What happened?
This is where most companies start. A carrier performance dashboard showing on-time delivery rates by lane, or a cost-by-mode breakdown across the last 12 months, is descriptive analytics. It establishes the operational baseline required before any deeper analysis is possible.
Business Solutions Group's Parcel Spend Intelligence platform functions at this level: consolidated dashboards let teams drill into parcel data, verify discount accuracy, and track cost category changes over time — all without pulling data manually from multiple carrier portals.
Diagnostic Analytics: Why It Happened
Diagnostic analytics goes one layer deeper, using root-cause analysis to explain why something went wrong. A delivery failure isn't just a data point — it's a signal. Diagnostic tools trace that signal back to its origin: a specific carrier lane, a warehouse bottleneck, a geography with recurring customs delays.
This is where reporting becomes insight. Without diagnostic capability, teams spend hours manually correlating data across systems — root causes that should take minutes to identify can stay buried for days.
Predictive Analytics: What Could Happen
Predictive analytics applies machine learning models to historical and real-time data to forecast future outcomes — demand spikes, stock-out probability, supplier disruption risk — weeks or months in advance. Teams stop reacting to problems and start anticipating them.
Business Solutions Group's demand planning software runs over 250 algorithms to forecast demand, predict sales, and optimize inventory. It integrates directly with ERP platforms, pulling the data inputs these models need to produce accurate outputs.
Prescriptive Analytics: What to Do About It
Prescriptive analytics is the most actionable tier. It takes predictive outputs and runs optimization models to recommend specific decisions: the ideal reorder quantity for a given SKU, the most cost-efficient routing combination, the best alternative carrier when a primary fails.
Where predictive analytics flags that a disruption is likely, prescriptive analytics goes further — it tells you which sourcing alternative to activate and what that decision will cost.
Key Applications: Where Analytics Creates Real Value
Four application areas consistently deliver the clearest, most measurable returns.
Demand Forecasting and Inventory Optimization
Inaccurate demand forecasting has a direct cost. Inventory carrying costs run 20–30% of total inventory value — meaning excess stock is expensive to hold and stockouts cost revenue. Retailers have already increased safety stock by 15–20% to buffer against disruption risk, driving carrying costs higher.
Predictive models change this equation. By combining historical sales data, seasonality patterns, promotional calendars, and market signals, they generate forecasts accurate enough to right-size inventory without over-padding it. Top-performing companies achieve 10–15% greater forecast accuracy than competitors, which translates directly to working capital freed from excess stock.
Better forecasting hits both sides of the margin equation: it reduces carrying costs while preventing the stockouts that erode revenue.
Logistics and Transportation Cost Reduction
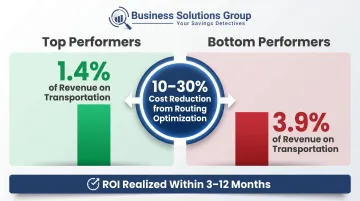
Transportation is where analytics spend pays back fastest. APQC benchmarking data shows top-performing organizations spend 1.4% of revenue on transportation. Bottom performers spend 3.9% — more than double. That gap is largely an analytics gap.
Prescriptive analytics optimizes routing, carrier selection, load consolidation, and scheduling across modes. The results are concrete: operations moving from manual planning to routing optimization software reduce transport costs by 10–30%, with ROI realized within 3–12 months across thousands of implementations.
Business Solutions Group's TMS delivers this through automated carrier comparison, load optimization, and multi-modal routing across parcel, LTL, FTL, air, ocean, and rail. Clients typically see 20–25% savings on LTL and 15–40% on small parcel, with 23.6% being the average achieved.
Supplier Performance and Procurement Intelligence
Analytics gives procurement teams objective visibility into supplier performance at scale. On-time delivery rates, quality defect trends, pricing history, and financial stability signals are aggregated and benchmarked against market data, shifting the negotiating dynamic entirely.
Digital World Class procurement organizations operate at 21% lower cost than peers — a $6 million annual advantage for a typical $10 billion company. That advantage comes from knowing what market rates actually are, which suppliers are underperforming, where contract terms have room to improve, and when to renegotiate before renewal cycles begin.
Business Solutions Group's spend intelligence platform provides this benchmark context, with visibility into thousands of pricing agreements and rate structures accurate to a tenth of a percent.
Supply Chain Risk Management
Risk management has become an analytics problem. With 82% of supply chain leaders reporting tariff impacts and geopolitical trade reorientation accelerating, reacting to disruptions after they hit is too expensive.
Advanced analytics continuously monitors the external signals that precede disruptions:
- Weather events and natural disaster forecasts
- Geopolitical shifts and trade policy changes
- Supplier financial health indicators
- Capacity constraints and lead time deterioration
When a risk threshold is crossed, teams receive an alert before the disruption hits. The same capability supports scenario planning: modeling what a tariff change or lane disruption would cost, and which contingency response is most efficient.
From Data to Dollars: The Business Benefits
The business case for supply chain analytics is straightforward: organizations that advance their capabilities consistently outperform those that don't — across costs, revenue, and working capital.
Gartner's research on supply chain analytics maturity documents specific, measurable outcomes for organizations that advance their capabilities:
- 20% reduction in inventory
- 10% improvement in customer service levels
- 10% increase in revenue
- 25% increase in available capacity
The working capital dimension is equally significant. Deloitte's analysis of 2,400+ U.S. public companies found the cash conversion cycle improved by 1.5 days in 2024, driven largely by a 1.1-day reduction in days inventory outstanding — a direct result of better inventory analytics.
The competitive gap between analytics leaders and laggards is widening. McKinsey finds that conventional benchmarking reveals 10–15% cost gaps between top and average performers — and granular, variable-level analysis uncovers 25%+ improvement potential on specific cost categories. Among companies with high-performing supply chains, 79% achieve above-average revenue growth, compared to just 8% of low-performers.
That performance gap doesn't close passively. With AI adoption in supply chains predicted to triple from 28% to 82% within five years, organizations still relying on manual processes and outdated reporting are falling further behind each quarter.
How to Implement Advanced Analytics in Your Supply Chain
Implementation succeeds or fails at the starting point. Most companies skip it.
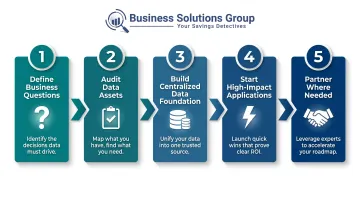
Step 1: Define the business questions first. Before selecting tools or platforms, identify the specific decisions analytics must support. "Where are we overspending on freight?" "Which SKUs are most at risk of stockout next quarter?" "Which supplier relationships carry the highest disruption risk?" Without defined questions, analytics produces data, not decisions.
Step 2: Audit existing data assets. Map what data you have, where it lives, and how complete it is. Shipping data spread across invoices, carrier portals, and internal spreadsheets is a common starting point — and a common problem. The audit reveals the integration work required before analysis can begin.
Step 3: Build a centralized data foundation. This means either a cloud-based data lake or an analytics layer integrated over existing ERP, WMS, and TMS systems. The objective is unified, real-time visibility — not periodic reports pulled from disconnected sources. Business Solutions Group connects ERP and WMS data into one automated reporting environment, replacing fragmented spreadsheets with consolidated dashboards that update as operations move.
Step 4: Start with high-impact, lower-complexity applications. Freight cost analytics and carrier performance dashboards deliver fast ROI and build organizational confidence in data-driven decision-making before more complex predictive modeling is introduced.
Step 5: Partner where internal capacity is limited. Most mid-sized businesses don't have internal data science teams, and building that capacity from scratch is rarely the right investment. Advisory firms like Business Solutions Group bring spend intelligence software and market benchmark data that would take years to replicate internally. BSG's no-cost benchmark analysis is a practical entry point: it establishes a performance baseline and surfaces the highest-value opportunities quickly, without a lengthy internal build.
Common Challenges and How to Overcome Them
Data Silos and Quality Issues
When supply chain data lives in disconnected systems across procurement, logistics, and finance, analysis produces incomplete or conflicting results. The consequences are real: 42% of executives cite lack of real-time data as their primary limitation when responding to disruptions, and 69% of compliance teams spend 11+ hours weekly on manual data translation.
Solutions include:
- API-based integrations that connect ERP, WMS, and TMS platforms
- Master data governance frameworks that standardize definitions across systems
- Centralized data repositories that consolidate parcel, LTL, and FTL data into one reporting structure
Talent Gaps
Advanced analytics requires a combination of supply chain domain expertise and data science skills that's genuinely scarce. U.S. manufacturing faced 409,000 unfilled positions in 2025, with the gap projected to reach 1.9 million by 2033.
Three viable approaches:
- Co-source with specialized analytics partners who bring both the tools and the expertise
- Invest in platforms that automate modeling and surface insights through user-friendly dashboards (reducing dependence on internal data scientists)
- Upskill existing staff — 38% of manufacturers planned re-skilling initiatives in 2025, up from 25% the previous year
Cultural Adoption
Analytics tools only create value when operational decisions actually follow the insights. The common failure mode: dashboards get built, teams keep making decisions the way they always have.
The real fix is structural, not more training. Embed analytics outputs directly into standard decision workflows so they can't be bypassed. Three practices that accelerate adoption:
- Tie dashboard usage to performance metrics so there's accountability
- Require data references in operational reviews and sourcing approvals
- Have leadership model the behavior — when senior decision-makers consistently ask "what does the data show?", teams follow
Frequently Asked Questions
What role does data analytics play in supply chain optimization?
Data analytics improves supply chain optimization by delivering visibility into bottlenecks, enabling accurate demand forecasting, identifying cost reduction opportunities, and supporting proactive risk management. It shifts decision-making from reactive to proactive, replacing lagging reports with timely insights that drive faster, more confident action.
What are the four types of advanced analytics?
The four types are descriptive (what happened), diagnostic (why it happened), predictive (what could happen), and prescriptive (what should be done). Each tier builds on the last, moving from historical reporting toward recommendations that guide real operational decisions.
What are the sources of data in manufacturing?
Key manufacturing data sources include ERP systems, manufacturing execution systems (MES), IoT sensors on production equipment, warehouse management systems (WMS), supplier records, and quality control logs.
What is a supply chain optimization analyst?
A supply chain optimization analyst uses data tools and analytical models to identify inefficiencies, reduce costs, improve forecasting accuracy, and recommend process improvements across procurement, logistics, inventory, and production. The role requires both industry knowledge and quantitative skills — turning raw data into recommendations that operations teams can act on.
What are the 5 C's of data management?
The 5 C's — Completeness, Consistency, Currency, Correctness, and Compliance — are data quality principles that ensure supply chain analytics is built on reliable inputs. Flawed or incomplete data produces misleading insights — and in supply chain contexts, that means poor inventory decisions, missed cost savings, and avoidable disruptions.