Introduction
U.S. business logistics costs reached $2.58 trillion in 2024, according to CSCMP's 36th Annual State of Logistics Report — representing 8.8% of GDP and a 5.4% increase over the prior year. For freight-heavy and parcel-dependent businesses, that figure isn't abstract. It's the environment every shipping decision lives in.
For a company spending $10 million annually on transportation, a 15% reduction recovers $1.5 million in margin — without touching headcount, pricing, or product mix. Business Solutions Group clients currently average 23.6% savings across parcel and freight spend, with results ranging from 15% to 40% depending on shipping profile.
That range comes down to identifying where costs actually originate. Most excess transportation spend traces back to avoidable decisions:
- Carriers contracted at outdated rates
- Shipments fragmented for convenience rather than cost
- Surcharges accepted without challenge
- Freight data siloed across systems where no one sees the full picture
This article covers how transportation costs build up, what drives them, and three strategic levers that produce real, sustained savings.
Key Takeaways
- Transportation costs accumulate through poor mode selection, invoice errors, and unmanaged surcharges — most go undetected without a formal audit
- Carrier rate structures, shipment fragmentation, accessorial charges, and rogue spend outside contracts drive the most waste
- Lasting savings come from three levers: procurement decisions, operational discipline, and network-level restructuring
- Benchmarking contracted rates against market data is the fastest way to expose where you're overpaying
- Companies that treat transportation as a strategic function — not just a cost center — compound savings over time instead of chasing one-off wins
How Transportation Costs Typically Build Up
Transportation spend rarely appears as a single, transparent line item. It accumulates across modes, carriers, surcharges, and invoice discrepancies — each individually small, collectively significant.
The Gradual Accumulation Problem
Costs build in layers. Consider what happens when a company consistently makes three common decisions:
- Defaults to expedited shipping for routine orders
- Separates shipments for warehouse scheduling convenience
- Accepts accessorial fees without questioning them
None of those choices look alarming in isolation. Across thousands of shipments, they compound into a material P&L problem.
The fragility usually becomes visible during disruptions — a carrier rate spike, a peak season surcharge increase, or an unexpected billing discrepancy triggers an audit that reveals the underlying pattern. By that point, the company has been overspending for months, sometimes years, without knowing it.
Why the Costs Stay Hidden
Data fragmentation keeps cost visibility low. Transportation spend typically sits across carrier invoices, ERP systems, TMS platforms, and individual business unit records — none of which are connected. Leadership sees aggregate freight costs, not the lane-level, mode-level, or carrier-level detail needed to spot inefficiencies.
That gap between what's visible and what's actually happening is where overspend hides.
Business Solutions Group closes that gap by capturing 6–12 months of shipment-level data to build a complete financial baseline. That baseline surfaces what most internal reviews miss — billing discrepancies, avoidable accessorials, and misapplied charges that accumulate below the threshold of manual review.
Key Cost Drivers in Transportation Management
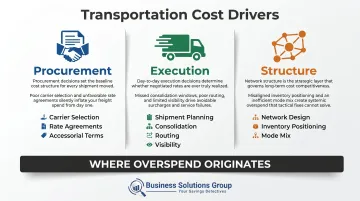
Transportation cost is shaped by three categories of drivers: procurement decisions, execution behaviors, and structural factors. Each operates differently and requires a different type of intervention.
- Procurement: Which carriers are used, at what rates, and under what contract terms. Contracts negotiated years ago — or never formally benchmarked — often contain rates that no longer reflect market conditions, with unreviewed accessorial charges compounding on top.
- Execution: How shipments are planned, consolidated, routed, and monitored once freight is moving. Fragmented shipments, manual processes, and limited visibility all produce excess cost during the active lifecycle of freight.
- Structure: Network design, inventory positioning, shipment frequency, and mode mix. These are slower-moving but often the highest-impact factors — fulfillment node locations set the cost floor of every shipment before any carrier negotiation begins.
Where Surcharges Become a Real Problem
Of the three driver categories, execution-level costs — and accessorial charges in particular — tend to be where the fastest recoverable savings hide. Industry data shows accessorial fees represent 20–35% of total parcel shipping spend — reaching up to 40% during peak seasons. Most shippers accept fuel surcharges, residential delivery fees, delivery area surcharges, and dimensional weight charges as standard — often without ever having an outside expert review their agreements.
Business Solutions Group's spend intelligence software flags billing discrepancies, misapplied accessorials, and rate deviations across these categories — often surfacing a gap between what clients are actually paying and what they originally negotiated.
Freight billing errors cost shippers an estimated 3–7% of total annual freight spend, with some estimates putting the exception rate as high as 22% of all invoices.
Cost-Reduction Strategies for Transportation Management
Effective transportation cost reduction targets the actual origin of cost — not just the visible line items. The three strategy groups below map to the three driver categories above.
Strategies That Change Procurement Decisions
Carrier benchmarking and contract renegotiation is often the highest-ROI starting point. Many businesses operate on contracts that predate current market conditions or were never formally compared against alternatives. Structured carrier sourcing processes typically generate 8–18% savings within 12 months, with rate renegotiation alone contributing 3–8%.
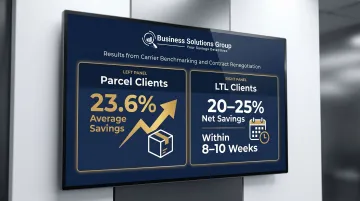
Business Solutions Group's proprietary spend intelligence software identifies where contracted rates deviate from market benchmarks — down to 1/10th of a percent. With visibility into thousands of pricing agreements, the firm builds renegotiation cases on documented data rather than estimates. Results have been consistent:
- Parcel clients have averaged 23.6% savings on current engagements
- LTL clients typically achieve 20–25% net savings within 8–10 weeks
Mode optimization is where shipper defaults become expensive. When a business consistently uses LTL or expedited parcel regardless of shipment size or transit time requirements, it pays a premium that better mode selection would eliminate. Intermodal contract rates ran 25.5% below truckload in Q1 2024, according to industry benchmarking data — a gap that compounds quickly at volume.