Introduction
U.S. business logistics costs reached $2.6 trillion in 2024 — equal to 8.7% of GDP, according to CSCMP's annual State of Logistics Report. Within that spend, McKinsey estimates inefficient logistics handoffs alone account for 13–19% of total logistics costs, representing up to $95 billion annually in avoidable waste.
Most of that overspend stays invisible until it's already compounded — buried in legacy carrier contracts, layered surcharges, and routing decisions made without current market data.
AI-powered shipping lane analysis addresses this gap directly — and the cost of not using it shows up in every carrier invoice. This article covers how lane costs accumulate, what's driving them in 2026, and the specific strategies AI-informed lane management makes possible.
Key Takeaways
- Lane costs compound quietly through inertia and poor visibility — not just rate increases
- Surcharges, peak premiums, and tariff volatility are the dominant 2026 cost drivers
- AI shifts lane decisions from reactive to predictive, benchmarking in real time
- The highest-impact strategies target decisions made before booking, not after
- Treating lane analysis as a continuous practice consistently outperforms annual renegotiation cycles
How Shipping Lane Costs Typically Build Up
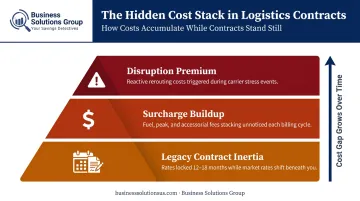
Lane overspend rarely arrives as a single budget shock. It accumulates in layers — each individually small, collectively budget-draining.
The most common pattern: a shipper locks in carrier contracts during an annual RFP cycle, then operates on those agreements for 12–18 months while market conditions shift. In early 2025, dry van spot rates sat around $1.95–$2.05 per mile, while contract rates held at $2.40–$2.45 per mile.
That's contract rates lagging spot trends by one to two quarters. Shippers without active benchmarking have no visibility into that gap.
Meanwhile, the Cass Transportation Index showed freight rates rising 2.8% month over month and 3.5% year over year in March 2025. That's not a spike — it's steady drift that erodes contract value while lane managers are focused elsewhere.
Three Patterns That Compound the Problem
- Routing through familiar carriers without re-competing lanes, even when cheaper market alternatives exist
- Fuel adjustments, peak fees, and accessorial charges stacking onto base rates with no line-item review
- Absorbing the most expensive rerouting options during disruptions, with no pre-built alternative lanes to fall back on
The cost exposure matters most during stress events. The Port of Los Angeles handled over 1 million TEUs in July 2025 — its busiest month on record — driven partly by tariff-related frontloading. Shippers without contingency lane models faced reactive rerouting at premium rates. Those with pre-built alternatives didn't.
That same dynamic plays out at smaller scale every day. Individual lane inefficiencies look minor at the shipment level — but aggregated across volume, routes, and time, they're the difference between a competitive freight budget and one that consistently underperforms.
Key Cost Drivers for AI-Powered Shipping Lane Analysis
In 2026, four drivers are generating the majority of avoidable lane spend — and most businesses are only tracking one of them.
Decision-Making Habits
The most persistent cost driver is process, not market rates. Businesses relying on annual RFP cycles, historical carrier relationships, or manual rate comparisons are structurally slower than a market that reprices continuously. By the time a contract comes up for renewal, months of above-market spend have already accumulated.
Surcharge Complexity
Surcharges don't show up in base rate comparisons, which is exactly why they compound unnoticed. For LTL shippers specifically, fuel surcharges alone can run 15–30% of base freight costs, with peak season premiums adding up to 30% above base rates during high-demand windows. During the 2025 retail peak season, truckload spot rates climbed 18.9% — from $2.32/mile in mid-November to $2.76/mile by late December.
Surcharge formulas vary by carrier and contract. Without systematic tracking, shippers have no visibility into when total lane cost has diverged from contracted rate expectations.
2026-Specific Pressures
Three external forces are accelerating the cost gap between businesses using AI lane analysis and those operating on static assumptions:
- Tariff volatility — McKinsey reports 82% of companies were affected by new tariffs, with 20–40% of total activity impacted and 43% planning to move more supply chain activity to the U.S.
- Near-shoring and reshoring — shifting dominant lane flows as manufacturers reposition sourcing and production
- Port capacity shifts — uneven demand across gateways as frontloading, trade policy changes, and routing adjustments redistribute volume
Cost Drivers Vary by Business Profile
A high-volume shipper's primary driver may be carrier contract positioning — they have leverage they're not using. A mid-size freight shipper's top driver is more likely mode selection inefficiency or lane consolidation gaps.
The key difference AI analysis provides:
- High-volume shippers: unused carrier leverage in existing contracts
- Mid-size freight shippers: mode selection gaps and consolidation opportunities
AI surfaces which driver dominates for each business, so cost-reduction efforts land where they actually matter.
Cost-Reduction Strategies for AI-Powered Shipping Lane Analysis
Effective cost reduction depends on identifying which layer of the problem is generating the cost. The strategies below are organized by where the leverage actually sits.
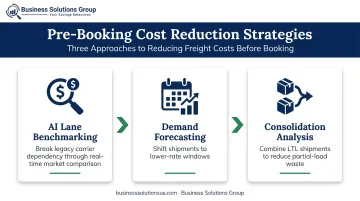
Strategies That Reduce Costs by Changing Decisions
These approaches target the decisions made before a shipment is booked — lane selection, carrier assignment, mode choice, and contract structure.
Use AI-powered lane benchmarking to break legacy carrier dependency
AI systems continuously compare actual lane spend against current market rates across carriers — exposing contracts where above-market rates have persisted simply because lanes were never formally re-competed. This creates the factual basis for proactive renegotiation rather than waiting for renewal cycles.
Business Solutions Group's proprietary spend intelligence software enables this type of benchmark analysis, translating lane data into specific carrier contract positioning. The platform's cost variance and margin analysis capabilities surface where contracted rates have drifted from market reality — and by how much.
Apply AI-informed demand forecasting to improve shipment timing
Many avoidable lane costs result from shipping during peak-rate windows because inventory or order triggers are purely reactive. When timing is flexible, AI forecasting models allow businesses to shift shipments to lower-rate windows — reducing both base rate exposure and surcharge accumulation without compromising service levels.
Run AI consolidation analysis to reduce LTL and partial-load waste
LTL represents roughly 10–15% of trucking industry volume, and consolidation decisions require cross-lane visibility that manual analysis can't provide at scale. AI tools identify lanes where multiple smaller shipments could combine into full loads, or where underutilized contracted capacity could absorb additional volume.
Walmart's expanded LTL consolidation program — replacing 42 purchase orders with a single national PO for suppliers — shows the concrete outcome: fewer transactions, lower per-unit freight cost, and reduced vendor coordination overhead.
Strategies That Reduce Costs by Changing How Lanes Are Managed
These approaches address the gap between booking a lane and managing its cost performance over time.
Implement real-time surcharge monitoring to prevent cost drift
AI platforms that continuously track carrier surcharge schedules, fuel indexes, and accessorial fee structures can alert shippers when a lane's total cost is escalating beyond contracted rates. This enables proactive carrier conversations or lane shifts before overspend accumulates — rather than discovering the variance in a quarterly invoice review.
Use predictive congestion modeling to avoid high-cost disruptions
McKinsey estimates B2B logistics suffers 850 million hours of detention or dwell time annually, driving $6 billion in logistics-provider revenue losses. AI models that analyze port congestion data, carrier on-time performance history, and external risk signals allow shippers to route around disruptions before they occur — avoiding expedite fees, detention charges, and reactive rerouting costs.
Automate lane performance scoring to trigger systematic renegotiation
Rather than reviewing carrier performance annually, AI-driven dashboards can score each lane continuously across cost, reliability, and transit time. Underperforming lanes surface in real time, with data documentation that supports renegotiation from evidence rather than anecdote. This shifts the renegotiation trigger from contract expiration to actual performance deviation.
Strategies That Reduce Costs by Changing the Context Around Lanes
In many cases, the lane itself isn't the core cost driver — the network structure surrounding it is.
Use AI location attractiveness scoring to inform distribution strategy
AI models evaluate the cost efficiency of shipping from or to different origin and destination nodes. The analysis covers:
- Lane density and carrier availability at each potential location
- Backhaul opportunities that reduce empty-mile exposure
- Cost differentials between consolidating versus maintaining distributed nodes
Businesses evaluating new warehouse locations should run this analysis before committing to fixed infrastructure. The lowest-cost lane isn't always connected to the most obvious location.
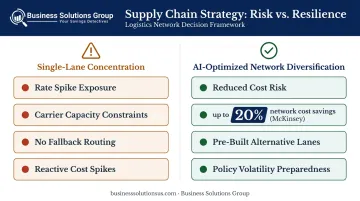
Reduce single-lane concentration risk through network diversification
Businesses routing a disproportionate share of volume through a small number of lanes face outsized exposure to carrier capacity constraints and rate spikes. AI network analysis identifies where diversification would reduce cost risk without increasing transit time. McKinsey's distribution research found AI-driven network optimization can reduce total network costs by up to 20%. That makes network resilience a direct cost-reduction lever, not just an operational safeguard.
Model tariff and regulatory change scenarios to reposition lane strategy
Trade policy volatility in 2026 is a material lane cost driver, not just a risk-management concern. AI scenario modeling allows shippers to simulate the cost impact of tariff changes on specific lanes and evaluate alternative routing strategies before changes take effect. Shippers who model these scenarios in advance can shift volume to domestic suppliers or alternate port pairs before rate increases lock in — turning policy volatility into a sourcing opportunity rather than an emergency response.
Conclusion
Reducing shipping lane costs requires knowing where the cost originates — whether in pre-booking decisions, active lane management, or the network structure surrounding individual routes. Blanket rate pressure and periodic renegotiation miss most of the leverage.
The businesses that consistently outperform on freight spend aren't necessarily the largest shippers or the most aggressive negotiators. They're the ones that have built ongoing lane intelligence into their operations — benchmarking against current market rates, tracking surcharge patterns before they compound, and managing each lane with the same discipline applied to any other cost center.
AI-powered lane analysis makes that continuous practice achievable at scale. For 2026, the real risk isn't adopting AI too early — it's letting avoidable freight spend compound another year while the decision stalls.
Frequently Asked Questions
Which location strategy is best for minimizing shipping cost?
The best location strategy is one informed by AI location attractiveness scoring — evaluating lane density, carrier availability, and backhaul opportunities at each potential node. Proximity to customers matters, but the lowest-cost origin or distribution point varies by volume, mode, and lane market conditions. Run the data before committing to fixed infrastructure.
Can AI do route optimization?
Yes. AI route optimization evaluates thousands of lane combinations simultaneously — weighing cost, transit time, carrier reliability, and risk factors — and ranks options based on the shipper's priorities. Manual or legacy TMS approaches can't match that speed or depth across a full lane network.
What data does AI use to analyze shipping lanes?
Key inputs include historical shipment and rate data, real-time carrier performance signals, port congestion indicators, fuel and surcharge indexes, and external risk data such as weather events and trade policy changes. Internal spend history combined with live market signals is what makes predictive lane decisions possible.
What is the difference between reactive and AI-driven freight lane analysis?
Reactive analysis looks backward at costs that have already occurred. AI-driven lane analysis is predictive and prescriptive: it identifies cost risks before they materialize and recommends specific actions to mitigate them, moving the decision timeline from after-the-fact to before-the-booking.
How do I know if my current shipping lanes are costing me more than necessary?
Benchmark your lane spend against market rates for comparable carriers and routes. Persistent above-market rates, high surcharge-to-base-rate ratios, and contract cycles without re-competition are the clearest signs of avoidable overspend. Business Solutions Group's no-cost benchmark analysis establishes that baseline quickly.
Can small and mid-size businesses benefit from AI-powered shipping lane analysis?
Smaller shippers often benefit most. Without internal resources to manually benchmark lanes, AI-driven spend intelligence delivers outsized value relative to freight volume. Business Solutions Group's parcel and freight spend intelligence platform provides actionable insights without requiring a dedicated analytics team.