Introduction
U.S. business logistics costs hit $2.58 trillion in 2024, representing 8.8% of GDP — well above the pre-pandemic baseline of 7.4–7.8%. That gap isn't driven by volume alone. A significant portion traces back to avoidable inefficiencies: unaudited surcharges, stale carrier contracts, unconsolidated shipments, and fragmented spend data that no one is actively watching.
Transportation costs don't arrive as one large, obvious line item. They compound across hundreds of individual decisions, each adding a small amount that feels manageable until someone actually audits the total:
- Freight class assignments
- Delivery address classifications
- Shipment timing and consolidation choices
- Carrier selection defaults
Business Solutions Group consistently finds that companies operating without independent benchmarking are overpaying by 15–30% on parcel contracts alone. The root cause isn't carelessness. Carrier pricing is intentionally complex, and the people setting those rates have far more data than the people paying them.
This article examines where transportation costs originate, which drivers compound most aggressively, and what specific strategies reduce them — organized by operational decisions, management practices, and structural contract changes.
Key Takeaways
- Transportation costs accumulate through layered charges — surcharges, minimums, accessorials — not as single visible expenses
- The biggest drivers are modal mismatches, stale contracts, unaudited accessorial fees, and fragmented spend visibility
- Cost reduction spans three levers: upfront decision-making, ongoing spend management, and network restructuring
- Spend intelligence tools convert fragmented invoice data into concrete, actionable savings opportunities
- Sustained optimization is continuous — businesses that benchmark and audit regularly stack savings quarter over quarter
How Transportation Costs Typically Build Up
Most transportation overspend isn't discovered in real time — it surfaces during audits, sometimes years after the charges accumulated.
The visibility problem is significant. A 2024 McKinsey survey of 88 senior supply chain executives found only 30% reported good visibility beyond their first tier of suppliers, down from 56% in 2022. When cost data is fragmented across carrier portals, invoices, ERP systems, and spreadsheets, pattern recognition becomes nearly impossible.
The compounding happens in predictable ways:
- Fuel surcharges float weekly and inflate base rates with no threshold alert to flag the increase
- Dimensional weight calculations apply to parcels that weren't measured or packaged with DIM weight in mind
- Accessorial fees — residential delivery, address corrections, additional handling — stack on top of base rates across thousands of monthly shipments
- Rate escalators in aging contracts push rates upward automatically, often with no one tracking the cumulative effect
Surcharges now account for 30–40% of total parcel spend for many shippers. Most businesses have never negotiated surcharges as a standalone cost category — which means they've been absorbing increases that were never part of the original deal.
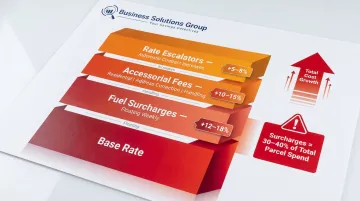
The typical discovery moment when Business Solutions Group conducts a first spend review: clients find they've been absorbing accessorial fees, zone increment charges, and minimum charge penalties that weren't part of their original cost model. Across those reviews, the gap between expected and actual spend consistently lands in the 15–30% range.
Key Cost Drivers in Transportation Spend
Most transportation overspend isn't random — it traces back to five specific, addressable drivers. Knowing which ones apply to your operation is the starting point for any meaningful cost reduction.
Modal Mismatch
Defaulting to one carrier or service level regardless of shipment characteristics is a reliable way to overpay. Using air freight when standard ground meets the delivery window, or sending LTL shipments that could consolidate to FTL, drives unnecessary per-unit cost.
Intermodal is a frequently overlooked alternative on long lanes. According to Inbound Logistics, intermodal shipping runs 8–18% less expensive than over-the-road trucking, with per-shipment savings of $500–$1,000 on long-haul routes. Intermodal volume grew 8.5% in 2024 — the market is moving in this direction for a reason.
Carrier Contract Structure
Contracts negotiated two or three years ago were built on a different shipping profile. Product assortments change, packaging evolves, volume shifts — but contracts often don't reflect any of it. The result: above-market base rates, missing volume discount thresholds, and minimum charges that no longer align with actual shipment patterns.
Business Solutions Group's benchmarking consistently finds that companies without recent independent review are overpaying by 15–30%. Structured contract management programs typically deliver savings of 8–18% within 12 months through rate renegotiation alone.
Compliance is a separate issue. Even well-negotiated contracts frequently aren't honored — rebates, discount tiers, and credit incentives are misapplied more often than most shippers realize.
Accessorial and Surcharge Creep
Accessorial fees can reach up to 40% of a total freight bill. Common charges and their current ranges:
| Accessorial Type | Current Rate Range |
|---|---|
| Ground fuel surcharge (UPS/FedEx) | 8–10% of base rate |
| Residential delivery | $4.25–$6.75 per package |
| Address correction | $12–$21 per correction |
| Additional handling | $3.50–$15.00 per package |
| LTL liftgate service | $50–$150 per shipment |
| LTL residential delivery | $75–$150 per shipment |
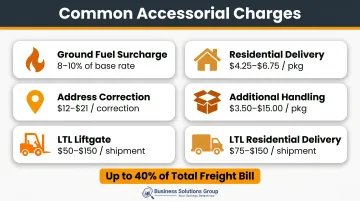
Many businesses unknowingly pay 10–15% more due to unmanaged accessorials. When shipping is decentralized and no one is tracking accessorial frequency by charge type, these costs accumulate without any corrective action.
Shipment Frequency and Timing
Urgency-driven shipping is one of the most expensive habits in logistics. Small, frequent, unplanned loads consistently cost more per unit than batched, consolidated moves. The problem compounds when teams optimize for order speed rather than freight economics. Every expedited shipment that could have waited 24 hours for consolidation represents a direct margin hit.
Lack of Spend Visibility
Frequency and timing problems are hard to spot without the data to see them. The same is true for every driver above. Without centralized data on what is being spent, with whom, at what rates, and across which lanes, none of these issues can be addressed systematically.
Fragmented invoice data across carriers isn't a reporting inconvenience. It's a structural barrier to cost control — one that keeps every other inefficiency invisible until the losses are already significant.
Cost-Reduction Strategies for Transportation Spend
The most effective strategies map directly to where costs originate. That means targeting decisions made upfront, the practices used to manage spend in motion, and the structural environment surrounding transportation operations.
Strategies That Reduce Costs by Changing Decisions
Modal and service level right-sizing
Systematically match mode to shipment weight, distance, and delivery timeline — not carrier preference or default routing. Specific thresholds worth evaluating:
- Lanes exceeding 750 miles: assess for intermodal conversion
- Shipments approaching FTL weight thresholds: model LTL-to-FTL cost comparison
- Ground-eligible shipments currently moving via expedited: review transit time requirements against actual business need
Shipment consolidation and batching
Consolidating fragmented LTL moves into planned, fuller loads can reduce per-unit shipping costs by 10–30%. Consolidation also reduces the number of individual shipments triggering accessorial charges and cuts administrative overhead.
Order pooling windows — holding orders 12–24 hours to combine with same-lane freight — are a practical starting point for most operations.
Carrier contract renegotiation using market benchmarks
Accepting carrier-proposed rate increases at renewal is one of the most common and expensive decisions in transportation procurement. Comparing current contract rates against independent market benchmarks before negotiations gives shippers leverage on base rates, minimum charges, and volume incentive structures.
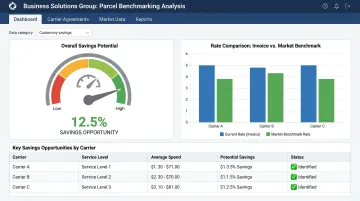
Business Solutions Group's benchmarking process analyzes parcel invoice history against a database covering thousands of pricing agreements, identifying discrepancies down to 1/10th of a percent. For companies that haven't renegotiated in the last 18–24 months, the savings potential is typically 15–30% — and Business Solutions Group provides the analysis at no cost before any commitment.
Strategies for Managing Transportation Spend More Effectively
Freight invoice auditing
Billing errors are not edge cases. According to industry data, roughly 1 in 5 invoices contain errors — including duplicate charges, weight classification mistakes, misapplied accessorials, and late delivery credits that were never issued. Systematic freight audit programs recover 3–7% of total freight spend annually for mid-market shippers.
Business Solutions Group's freight audit and recovery service covers parcel, LTL, FTL, air, ocean, and rail — auditing every invoice against contracted terms to ensure clients pay only for services actually incurred. Most clients see returns within the first billing cycle.
Spend intelligence and benchmark analysis
Standard carrier reports show activity. Spend intelligence identifies what's driving costs and where to act.
Business Solutions Group's Parcel Spend Intelligence platform consolidates data from carrier portals, ERP systems, WMS, and invoices into a single dashboard. It surfaces over 40 actionable insights, including:
- Accessorial charges occurring above expected frequency
- Service levels being paid for that don't align with delivery performance
- Billing discrepancies between manifest data and invoices (Parcel Cost Variance module)
- True product-level margin after shipping costs are applied (Parcel Margin Analysis module)
The platform manages over $3 billion in parcel spend and has generated more than $350 million in annual savings across its client base. Unlike carrier-provided reporting, it includes proactive alerts — notifying teams when costs exceed defined thresholds before the billing cycle closes.
Accessorial charge review and policy controls
Reducing accessorial frequency requires operational changes, not just contract language. Practical policy controls that reduce charge exposure:
- Standardize delivery addresses to commercial locations where possible
- Pre-schedule dock appointments to eliminate detention and wait-time fees
- Audit freight classifications before shipment rather than disputing after delivery
- Set internal routing rules that flag residential deliveries for review before tender
These changes don't require carrier renegotiation — they reduce the conditions that trigger charges in the first place.
Strategies That Reduce Costs by Changing the Context Around Transportation
Route optimization
Route planning software that accounts for traffic, delivery windows, vehicle capacity, and multi-stop sequencing reduces fuel consumption, driver time, and failed delivery attempts. McKinsey research indicates AI-driven route optimization delivers 10–20% reductions in delivery costs, with fuel savings reaching up to 13% and vehicle miles traveled reductions of up to 23% according to National Academies analysis.
Real-time rerouting during disruptions compounds these savings by preventing costly re-delivery attempts.
Network and warehouse positioning
Zone-based pricing escalates with distance. Each additional zone compounds per-package cost — making fulfillment location one of the highest-leverage variables in transportation spend. Companies that position distribution inventory near major demand clusters can reduce zone-based shipping costs by 18–30%.
This doesn't always require owned facilities. 3PL partnerships and distributed fulfillment arrangements can achieve similar zone reduction without capital investment.
Backhaul and freight pooling partnerships
Empty return miles represent fixed costs with zero revenue offset. Backhaul arrangements — coordinating with carriers or 3PLs to fill return legs — distribute those fixed costs across more freight, lowering effective rates for both parties. Freight pooling links geographically similar shipments from multiple shippers, reducing per-unit cost on lanes that wouldn't otherwise support dedicated moves.
Conclusion
Sustainable transportation cost reduction isn't about cutting spend across the board — it's about identifying precisely where costs originate and addressing them systematically. Overspend rarely concentrates in one place. It surfaces in upfront decisions like wrong mode selection and unrenegotiated contracts, in how spend is managed through unaudited invoices and unchecked accessorial accumulation, and in structural factors like network positioning and carrier relationships.
Each layer requires a different fix.
The businesses achieving the greatest and most durable reductions treat optimization as ongoing practice — benchmarking regularly, auditing every billing cycle, and adjusting as shipping profiles evolve.
Business Solutions Group works with clients as a continuous partner. Engagements include:
- Ongoing KPI tracking and spend intelligence reporting
- Re-benchmarking as carrier rates and market conditions shift
- Monthly or quarterly business reviews to surface new savings
- Compensation tied to value delivered — the incentive to find savings never expires
If your contracts haven't been independently benchmarked in the last two years, an independent benchmark analysis is the right starting point. Most businesses find the gap between what they're paying and what the market supports is larger than they anticipated.
Frequently Asked Questions
How do I optimize transportation spend and reduce shipping costs?
Start with spend visibility — understand exactly what you're paying, to whom, and why. Then target the highest-cost drivers: modal mismatches, unaudited accessorial charges, unconsolidated shipments, and carrier contracts that haven't been benchmarked against market rates.
What is transportation optimization?
Transportation optimization is the systematic process of improving how goods are moved — across routes, modes, carriers, and shipment structures — to reduce cost, improve reliability, and increase efficiency. This applies to both individual shipment decisions and overall network design.
How do you optimize transportation routes?
Route optimization uses software to plan multi-stop delivery paths that minimize distance, fuel consumption, and time, factoring in traffic patterns, delivery windows, and vehicle capacity. AI-driven tools typically deliver 10–20% reductions in delivery costs, according to McKinsey research.
What is the cost of LTL freight?
LTL contract rates average $46.40 per hundredweight (CWT) as of Q1 2025, with per-pound rates ranging from $0.22–$0.42 depending on freight class, lane, and carrier. Accessorial charges frequently add 10–40% beyond the base linehaul rate.
What are LTL transportation services?
LTL (Less-Than-Truckload) services allow shippers to pay only for the trailer space their freight occupies, making it cost-effective for shipments that don't fill a full truck. The trade-off is typically longer transit times and more handling touchpoints compared to FTL.
How can I get discounted USPS shipping?
USPS discounts are available through Commercial Pricing via Click-N-Ship, volume agreements for qualifying shipment thresholds, and third-party platforms that aggregate shipper volume for better rates. Benchmarking USPS rates against other parcel carriers using spend data often surfaces savings that aren't visible when evaluating carriers individually.