What makes logistics costs particularly hard to control is that they rarely announce themselves. They accumulate through hundreds of small, repeated decisions — a slightly longer daily route, a partially filled trailer, a carrier contract renewed without benchmarking. By the time the pattern becomes visible, months of overspend have already compounded.
Transportation accounts for 63.1% of total U.S. business logistics costs, making it the single largest cost category and the most direct target for reduction efforts. Route optimization, carrier management, and load planning decisions don't just affect one shipment — they replay across every run, every day.
This guide covers how logistics costs build up, what drives them, and three strategic dimensions for reducing them through smarter routing and carrier management in 2026.
Key Takeaways
- Logistics costs compound through repeated small inefficiencies, not one-time budget events
- Transportation at 63.1% of logistics spend makes routing decisions the highest-ROI cost lever
- Meaningful reduction targets three layers: upstream planning, real-time execution management, and network-level structure
- Carrier benchmarking and freight invoice auditing recover costs that optimization software alone misses
- The goal is targeted intervention at each cost source — where it originates, not where it shows up on a report
How Logistics Costs Typically Build Up
Most logistics overspend doesn't come from a single bad decision. It comes from the same sub-optimal decision made 500 times a week.
A route that runs five miles longer than necessary. A truck dispatched at 60% capacity. An accessorial charge billed incorrectly and paid automatically. None of these events is catastrophic in isolation. Multiplied across a fleet running daily deliveries, they produce significant annual losses.
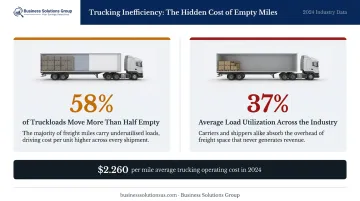
The buildup is also compounding in structure. Inefficient routing increases fuel consumption. That extends driver hours, raises labor costs, and accelerates vehicle wear — each inefficiency feeding the next. According to ATRI, the average trucking operating cost reached $2.260 per mile in 2024 — a high base on which any routing inefficiency compounds fast.
Load utilization makes the picture worse. A 2025 shipper study found that 58% of truckloads moved more than half empty, with partially loaded trucks averaging just 37% utilization. At those utilization rates, the cost-per-unit shipped is roughly double what a full load would deliver.
These costs also stay hidden longer than most shippers expect. Reviewing a single invoice reveals nothing — the pattern only surfaces through benchmark comparison or a portfolio-level audit. When it does, the finding is typically the same: years of accumulated overspend from charges that each looked normal in isolation.
That's where the opportunity lies. Identifying these patterns is the first step toward recovering margin — and it starts with the decisions being made at the route level every day.
Key Cost Drivers for Logistics Operations
Internal Factors
The primary internal levers that shape a business's cost profile include:
- Delivery geography and shipment density — sparse delivery zones require more miles per stop, directly raising cost per delivery
- Fleet composition — mismatches between vehicle capacity and typical load size create structural underutilization
- Carrier contract terms — base rates, accessorial fees, and minimums locked in without benchmark data leave money on the table
- Order scheduling alignment — non-clustered delivery windows force routes to backtrack, adding miles and time
External Conditions
These internal inefficiencies become far more expensive when external conditions shift against you. Fuel surcharges, for instance, are indexed to diesel prices in real time. XPO's current LTL fuel surcharge table shows a 32.25% surcharge at $3.831/gallon diesel — a figure that changes weekly based on EIA pricing. Seasonal demand surcharges from major parcel carriers can reach $485–$540 per package during peak windows, per Sifted's 2025 carrier guide.
When internal inefficiencies meet external volatility, the cost exposure compounds. A poorly consolidated LTL shipment during a fuel surcharge spike costs far more than it would in a stable fuel environment.
Where the Dominant Drivers Differ
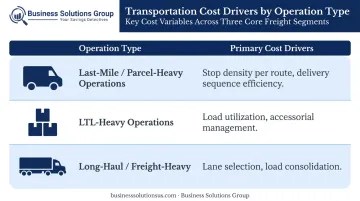
The critical lever varies by operation type:
| Operation Type | Primary Cost Driver |
|---|---|
| Last-mile / parcel-heavy | Stop density per route, delivery sequence efficiency |
| LTL-heavy | Load utilization, accessorial management |
| Long-haul / freight-heavy | Lane selection, load consolidation |
Cost-Reduction Strategies for Logistics
Logistics cost reduction fails when it addresses only one layer of the problem. The strategies below cover three distinct levels: the decisions made before trucks leave the dock, how routes are managed once active, and the structural conditions that shape every delivery. Address one layer while ignoring the others and the savings from each layer shrink.
Strategies That Reduce Costs by Changing Decisions
These strategies target choices made before dispatch. Getting them right reduces the cost ceiling that execution-layer optimization then has to work within.
Rethink route planning as network design, not dispatch. Before applying any software, batch deliveries by geographic cluster, time window compatibility, and stop density. Eliminating backtracking at the design stage reduces total miles driven regardless of what optimization tools are applied afterward.
Evaluate carriers on total cost, not headline rate. Base rate plus accessorial exposure plus historical service reliability is the complete picture. A carrier with a low base rate and poor on-time performance creates downstream penalty costs that often exceed the rate savings. Business Solutions Group's freight advisory engagements typically achieve 20–25% average savings on carrier contracts — in part because they evaluate total cost rather than accepting carrier-proposed rate structures.
Reduce LTL dependency through consolidation. Key consolidation levers include:
- Adjusting order minimums to support fuller loads
- Extending consolidation windows to combine compatible shipments
- Restructuring customer delivery schedules to align with route geography
Use benchmark data before entering negotiations. Carriers propose increases based on their cost position, not yours. Approaching a contract renewal with spend intelligence data — what comparable shippers pay on similar lanes and volumes — consistently produces better outcomes than reacting to carrier proposals.
Strategies That Reduce Costs by Changing How Routes Are Managed
Once routes are in motion, execution management determines how much of the planned efficiency actually reaches the bottom line.
Deploy real-time dynamic rerouting. When unexpected gridlock hits a static optimized route, it erases much of what the optimization was designed to produce. Real-time traffic integration allows drivers to adapt without defaulting to longer paths.
Track cost-per-delivery at the route level, not the fleet average. Monthly fleet averages hide the routes and zones driving cost. Granular route-level tracking:
- Creates accountability at the delivery zone level
- Surfaces recurring inefficiencies invisible in aggregate data
- Enables direct comparison across drivers, time windows, and service areas
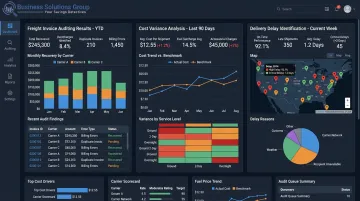
Business Solutions Group's Parcel Business Intelligence tools provide 25+ actionable insights through cost variance analysis, invoice auditing, and delivery delay identification — exactly the kind of route-level visibility that fleet averages obscure.
Automate freight invoice auditing. Ground parcel accessorial charges per package were 16.4% higher in Q4 2024 than Q3 2024, according to the TD Cowen/AFS Freight Index. UPS alone made eight fuel surcharge increases in 2024. At that rate of change, manual invoice review can't keep pace. Automated auditing systematically catches duplicate charges, billing discrepancies, and missed service guarantee refunds before they become accepted costs.
Build driver feedback loops. When drivers see how their actual route compares to the optimized plan — miles deviated, time added, fuel difference — deviation rates decline. Drivers who see route deviation data weekly reduce off-plan miles faster than those who encounter it in a quarterly review.
Strategies That Reduce Costs by Changing the Context Around Routes
Some persistent logistics costs aren't caused by routing gaps or management failures. They're caused by structural conditions that optimization can't fix on its own.
Reposition inventory closer to demand. Distribution point location determines average transit distance before any route algorithm runs. A network misaligned with actual delivery geography has a higher cost floor regardless of the software applied to it. Network redesign is a longer engagement, but it's the only intervention that changes that floor.
Evaluate intermodal options for high-volume long-haul corridors. Railroads are 3–4 times more fuel-efficient than trucks, per the Association of American Railroads. For trunk-leg movement on high-volume lanes, shifting to rail intermodal with optimized final-mile delivery can lower total cost per shipment — particularly as diesel surcharge volatility increases carrier rates.
Align delivery frequency with actual demand patterns. Gartner predicts that 70% of large organizations will use AI-based supply chain forecasting by 2030. The immediate benefit: eliminating route runs during low-demand periods reduces fuel spend and driver hours without reducing service availability. Unnecessary frequency is one of the most overlooked sources of logistics cost because it feels like service coverage rather than waste.
Engage a logistics cost optimization advisor. Structural cost reduction requires modeling scenarios across the full delivery network — not just adjusting individual routes. Business Solutions Group's proprietary spend intelligence software and supply chain advisory services work at the network level — identifying where costs are structurally inflated and building the case to reduce them. Clients see 15–30% reductions on LTL and 15–40% on parcel contracts through benchmark-driven negotiations.
Conclusion
Cutting logistics budgets without understanding where cost originates creates short-term relief and long-term recurrence of the same problems. The inefficiencies return because their structural causes were never addressed.
What actually works is identifying the cost source — whether it's in pre-execution decisions, live route management, or network-level context — and applying targeted interventions at each layer. Route optimization isn't a software installation. It's an ongoing discipline that operates across every decision in the logistics operation. The businesses that achieve durable savings build it into how they plan, contract, and execute — not as a one-time project, but as an operational standard. If you're ready to identify where your logistics spend is leaking and put a structured reduction plan in place, that's where an advisory partner earns its value.
Frequently Asked Questions
What is an example of route optimization?
A food distributor using routing software to cluster stops by neighborhood and sequence them to eliminate backtracking is a practical example. In one documented case, this approach reduced cost per case by 20% and compressed route planning time to under 30 minutes.
How do you reduce cost per delivery?
The primary levers are increasing stops per route through better geographic sequencing, consolidating shipments to maximize load utilization, and tracking cost-per-delivery as a KPI by route — not just as a fleet average. Route-level data shows exactly which zones are dragging up total costs.
What percentage of logistics costs does transportation represent?
Transportation accounts for 63.1% of total U.S. business logistics costs, according to 2024 State of Logistics data. This makes carrier contracts, lane decisions, and route efficiency the single highest-impact area for cost reduction.
How does route optimization software work?
These tools use algorithms to calculate the most efficient stop sequence for multiple deliveries, factoring in constraints like time windows, vehicle capacity, and real-time traffic. The result is fewer total miles and less time per route than manually planned equivalents.
What are the biggest hidden logistics costs businesses overlook?
The most common categories of untracked overspend include:
- Accessorial charges billed incorrectly
- Empty or underloaded miles
- Manual invoice errors that automated auditing would catch
- Expedited shipments triggered by poor demand forecasting
When is the right time to invest in route optimization technology?
Operations running 10 or more daily deliveries typically see measurable returns. The ROI case becomes clear once you establish a baseline of current cost-per-delivery, fuel spend, and overtime hours — that's what makes the before/after comparison defensible.