Introduction
Shipping costs rarely feel catastrophic in any single month. They just keep climbing. According to APQC's 2024 benchmarking data covering 1,456 companies, median transportation cost sits at 0.83% of revenue — but that figure obscures how quickly unmanaged shipping programs drift above it.
The culprit is rarely a single rate hike. It's the compound effect of annual general rate increases (GRIs), fuel surcharge escalations, dimensional weight charges, delivery area surcharges, and operational decisions made without rate data. Each item looks small in isolation. Together, they erode margin in ways that don't surface until someone audits the invoices.
Carrier management software (CMS) addresses this problem at its roots. This article breaks down where CMS creates measurable savings: pre-shipment decisions, active carrier relationship management, and the structural factors — packaging, fulfillment positioning, carrier mix — that only become visible and actionable once the data exists to see them.
Key Takeaways
- UPS and FedEx GRIs have averaged 6.1% annually from 2022 to 2026, compounding material cost pressure on every contract period
- Accessorial fees — fuel surcharges, delivery area charges, dimensional weight — frequently outweigh the stated GRI impact
- Freight audit programs typically recover 1% to 5% of total freight spend
- CMS replaces reactive, single-carrier decisions with data-driven carrier comparison, automated auditing, and performance monitoring
- Combining software insight with changes to packaging, carrier mix, and fulfillment positioning produces the greatest overall savings
How Shipping Costs Build Up Over Time
Most shippers assume their costs move with the announced GRI. They don't.
UPS and FedEx headline GRIs from 2022 to 2026 ran 5.9%, 6.9%, 5.9%, 5.9%, and 5.9% respectively — a five-year average of 6.1%. A shipper who simply renewed their existing contract each year without renegotiating accepted that compounding increase in full. Over five years, that's not incremental — it's structural cost growth baked silently into every shipment.
Why Surcharges Are the Real Story
The headline GRI understates true cost movement. Consider what's happened alongside base rate increases:
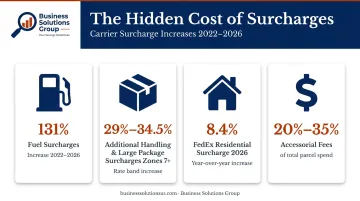
- Fuel surcharges rose 131% from 2022 to 2026, according to AFS/TD Cowen's Q2 2026 freight index
- Additional Handling and Large Package Surcharges for Zones 7 and above increased 29% to 34.5% since December 2024
- FedEx's 2026 Ground/Home Delivery Residential Surcharge rose 8.4% — well above the 5.9% headline figure
- Accessorial fees as a category typically represent 20% to 35% of total parcel shipping spend
These costs don't appear as a single line item. They accumulate across hundreds of invoices and dozens of surcharge categories — against a rate structure most shippers haven't revisited since their last contract was signed.
The Invisible Cost Gap
Without centralized shipment data, businesses can't see where cost is actually originating. Transportation Insight and SupplyChainBrain both report that 1% to 5% of total freight spend is typically recoverable through freight audit — money already paid that shouldn't have been. For a company spending $2 million annually on shipping, that's $20,000 to $100,000 sitting in carrier billing errors.
Key Cost Drivers in Carrier Management
Four drivers account for most of the cost gap between shippers with well-managed programs and those without. Knowing which ones apply to your shipping profile is where meaningful savings start.
Contract Terms Without Market Context
Most shippers negotiate carrier contracts by asking for a percentage discount off published rates. The problem is that published rates are a starting point, not a benchmark. Without access to what comparable shippers are actually paying on similar lanes, there's no way to know whether a 40% discount is competitive or whether the same volume would command 55%.
Carrier pricing is also layered. Evaluating a contract requires modeling headline rates, minimum charges, zone-specific fees, fuel surcharge tables, DIM weight divisors, and accessorial fee schedules together — not just the top-line discount percentage.
Rate Complexity as a Compounding Factor
The interaction between GRIs, zone charges, dimensional weight, and accessorial fees makes it nearly impossible to project true per-shipment cost manually. A shipper with heavy residential volume in rural zones faces a different cost structure than one shipping primarily to urban commercial addresses — even at identical "discount" levels.
Shipware's analysis of DIM weight pricing shows that moving from a DIM divisor of 139 to 166 on a high-volume ground account reduces dimensional weight charges by more than 16% on every dimensionally billed shipment. That's a contract term most shippers never negotiate because they don't have the data to see it matters.
Operational Decisions at the Point of Shipping
Several daily decisions — made manually and inconsistently — quietly accumulate into significant cost exposure:
- Defaulting to 2-day air when ground would have met the delivery window
- Triggering dimensional weight charges because box sizes were never rationalized against product dimensions
- Assigning carriers by habit rather than by lane-level cost or service data
These patterns are invisible individually. They only become visible when aggregated shipping data reveals what's actually driving cost at scale.
Shipment Profile Mismatch
A one-size-fits-all cost reduction approach misses the most important variable: what a shipper's actual shipment mix looks like. High average shipping zones drive zone-based surcharge exposure. Irregular package dimensions create dimensional weight risk. Identifying which drivers are most relevant to your specific profile is what makes the difference between a negotiation that moves the needle and one that doesn't.
Cost-Reduction Strategies for Carrier Management Software
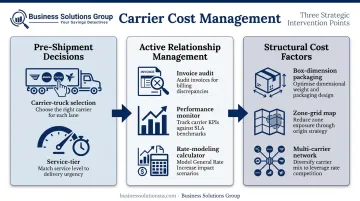
The strategies below are organized by where they intervene in the cost cycle. Some change the decisions made before shipments move. Others tighten control during active carrier relationships. A third group addresses structural factors that only become visible through aggregated shipment data.
Strategies That Reduce Costs by Changing Decisions
Data-driven carrier selection replaces the default single-carrier approach with per-shipment optimization. CMS consolidates rate data, delivery performance history, and zone coverage across multiple carriers, allowing shippers to match each shipment to the most cost-effective option for its specific characteristics — weight, zone, service window, and destination type. At scale, those per-shipment savings compound into measurable cost reductions across the full shipping program.
Market-benchmarked contract negotiation removes the information asymmetry that has historically favored carriers. The primary reason shippers accept unfavorable contract terms is that they enter negotiations without knowing what comparable shippers are paying.
Business Solutions Group's parcel business intelligence software closes that gap — it reveals true costs, benchmarks rates to highlight negotiation opportunities, and models proposed carrier pricing to show the impact of each rate, fee, and surcharge before a contract is signed. That combination of visibility and modeling changes the negotiation dynamic.
Service level discipline is underutilized. A meaningful share of shipping cost overruns comes from defaulting to premium service tiers when ground or deferred options would meet the actual delivery window. CMS enables shippers to audit their historical service level mix and build rules that match each shipment's urgency and destination to the appropriate — and lowest-cost — service option.
Strategies That Reduce Costs Through Better Relationship Management
Automated freight invoice auditing catches what manual processes miss. Carrier billing errors — incorrect weight assessments, unapplied contract discounts, unauthorized surcharge additions — are common and difficult to detect at volume. The recoverable amount, per multiple industry sources, runs 1% to 5% of total freight spend.
Refund claims must be filed within 180 days of the billing date, which means errors caught late or missed entirely represent permanent losses. Automation solves the detection problem by verifying each invoice against contracted terms before payment.
Real-time carrier performance monitoring matters for cost, not just service quality. Late deliveries, damage events, and poor exception handling generate downstream costs: customer service claims, replacement shipments, returns, and expedited re-sends.
CMS tracks on-time delivery rates, damage frequency, and exception handling against contracted SLA commitments — giving shippers the evidence to hold carriers accountable and make objective decisions at renewal rather than defaulting to the incumbent.
Proactive GRI impact modeling closes the gap between the announced headline increase and what a shipper will actually pay. A 5.9% average GRI means different things depending on a shipper's zone distribution, weight band concentration, and surcharge exposure. CMS applies an announced GRI to a shipper's actual historical shipment mix — accounting for all these variables — to produce a real cost impact figure. That number is what should drive budget planning and contract negotiation, not the press release percentage.
Strategies That Address Structural Cost Factors
Dimensional weight and packaging optimization starts with visibility. CMS data surfaces patterns in dimensional weight charges across a shipper's shipment history — identifying which SKUs, packaging configurations, or product categories are consistently triggering DIM billing. Right-sizing packaging for frequently shipped items directly reduces billed weight on every affected shipment.
UPS and FedEx both apply a DIM divisor of 139 as their standard calculation. Negotiating a higher divisor can cut DIM charges by over 16%, making this both an operational and a contractual lever.
Fulfillment network and zone optimization uses zone distribution data to evaluate whether inventory is positioned where it needs to be. Each additional shipping zone adds cost — and with zone-linked surcharges rising 29% to 34.5% since late 2024 for high-zone shipments, the cost of geographic misalignment has increased.
CMS quantifies the savings available from repositioning inventory closer to key customer markets. CRIMPiT, a company that optimized its fulfillment network through ShipBob's distributed inventory model, reduced shipping costs by 45%.
Multi-carrier and modal diversification eliminates the single-carrier dependency that removes competitive leverage and price discipline. CMS enables systematic comparison across regional parcel carriers, alternative networks, and LTL or consolidation services — allowing shippers to build a carrier mix where each shipment type is matched to the lowest-cost option that meets service requirements.
Regional carriers frequently offer lower rates on specific lanes where they run dense networks. Accessing those rates, though, requires the data infrastructure to compare and manage multiple carrier relationships simultaneously.
Conclusion
Carrier management software reduces shipping costs by pinpointing exactly where cost originates in the carrier relationship and intervening at the right point: a contract term, a billing error, a DIM weight pattern, or a fulfillment network adding unnecessary zones.
The work is continuous. GRIs reset cost baselines annually, and surcharge tables move independently of base rates. Shipment profiles shift with product changes and customer geography. The carrier mix and contract structure that delivers optimal cost today will drift without ongoing monitoring and re-evaluation.
Businesses that pair carrier management software with expert advisory support — including contract negotiation and spend analytics from firms like Business Solutions Group — are positioned to capture savings repeatedly rather than once. The data surfaces the opportunity. Consistent action on it is what converts short-term wins into sustained margin improvement.
Frequently Asked Questions
What are the benefits of carrier management?
Carrier management provides multi-carrier visibility, improved negotiation leverage through spend benchmarking, automated invoice auditing, and continuous performance monitoring. The result is lower cost per shipment, fewer unrecovered billing errors, and better data for every carrier decision.
How does carrier management software reduce shipping costs?
CMS replaces manual, single-carrier processes with automated rate comparison, contract benchmarking, and shipment-level optimization. It also surfaces billing errors before payment and models the true cost impact of rate changes against a shipper's actual shipment mix.
What features should I look for in carrier management software?
Key capabilities include multi-carrier rate comparison, automated freight invoice auditing, real-time shipment tracking, carrier performance analytics, contract management tools, and GRI impact modeling. Spend intelligence and benchmarking features prove most valuable during contract negotiations.
How is carrier management software different from a TMS?
A TMS manages the broader logistics execution process: routing, load planning, and mode selection. Carrier management software focuses specifically on carrier selection, performance benchmarking, contract governance, and cost optimization. The two often overlap or integrate in enterprise deployments.
Can small businesses benefit from carrier management software?
Yes. Even low-to-mid volume shippers benefit from rate comparison, automated auditing, and carrier performance visibility. Billing error recovery and improved contract terms typically offset software costs quickly, and advisory engagements structured on contingency mean there's no upfront financial risk.
How does carrier management software help manage the impact of General Rate Increases?
CMS applies an announced GRI to a shipper's actual historical shipment data, accounting for zone distribution, weight bands, service levels, and surcharge interactions. The resulting cost impact estimate supports proactive budget planning and better-informed negotiations before new rates take effect.