Introduction
You have a TMS. You have an ERP. You have carrier portals, a warehouse system, and no shortage of spreadsheets. Your team pulls reports weekly, and yet someone in the Monday meeting still can't answer: "Which carrier is actually costing us the most?" or "Where are we losing margin on Midwest lanes?"
That's the supply chain data paradox: drowning in data, starving for answers.
The problem isn't a lack of information. It's fragmentation. Shipping data lives in carrier portals, procurement history sits in ERP exports, inventory counts are in the WMS, and accessorial charges are buried in invoices nobody's audited in months.
Each system tells part of the story. Nobody sees the whole picture.
That fragmentation has a real cost: wasted hours, missed savings, and decisions made on gut instinct rather than evidence. What follows breaks down how to close that gap — and what it looks like when supply chain data finally works for you instead of against you.
Key Takeaways
- Supply chain data siloed across ERPs, TMS platforms, carrier portals, and spreadsheets makes unified decision-making nearly impossible.
- The hidden cost is significant: supply chain professionals spend nearly 14 hours per week on manual data reconciliation alone.
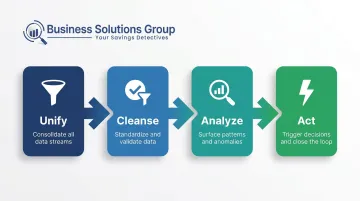
- Turning data into decisions requires four steps: Unify, Cleanse, Analyze, Act.
- Carrier spend, procurement records, and inventory data are the highest-value sources to consolidate first.
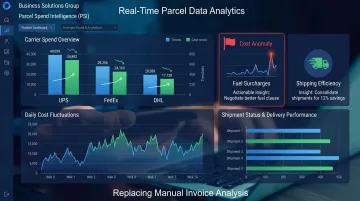
- Business Solutions Group's proprietary PSI platform replaces weeks of manual invoice analysis with real-time spend visibility.
What Is Fragmented Supply Chain Data (and Why It's So Common)?
Fragmented supply chain data describes a state where operational information is scattered across disconnected systems — ERPs, warehouse management systems, transportation management systems, carrier portals, and spreadsheets — with no single source of truth. Each department sees a different slice of reality.
Most supply chain operations run across four to seven disconnected systems with no unified data model. And according to G2's 2023 supply chain statistics compilation, only 6% of businesses claim complete visibility over their entire supply chain. The root cause is structural, not technological.
Why Fragmentation Is the Default
Supply chains didn't fragment overnight. They evolved organically:
- Procurement adopted one tool. Logistics adopted another.
- Acquisitions layered in legacy platforms that never got integrated.
- Carrier portals proliferated as shipping relationships expanded.
- Spreadsheets filled the gaps — and stayed long past their expiration date.
That last point is more persistent than most organizations admit. Nearly 60% of organizations still rely on spreadsheets to predict, monitor, and manage supply chain activities. When Business Solutions Group engages new clients, shipping data is routinely spread across carrier invoices, internal systems, and manual workbooks — with none of it talking to each other.
The Difference Between Data and Intelligence
Most businesses are data-rich and insight-poor. Raw carrier invoices, inventory logs, and purchase order records don't yield much on their own — value emerges when that data is connected and put in context.
The data usually exists. What's missing is the ability to use it. 84% of supply chain professionals cite lack of visibility as their greatest challenge, even when the underlying records are technically accessible somewhere in their systems.
The Real Cost of Keeping Data Fragmented
Fragmentation isn't just an IT inconvenience. It's a profitability issue that shows up in measurable ways.
Operational Drag
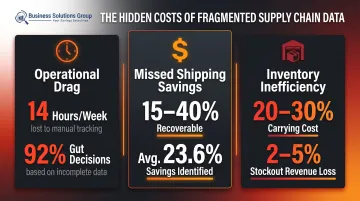
A 2024 LeanDNA/Wakefield Research survey of 250 supply chain executives found that supply chain professionals spend nearly 14 hours per week — almost two full workdays — manually tracking data. That's time not spent on negotiation, optimization, or strategy.
The same survey found 92% of executives admit to making gut decisions at least sometimes because their reports lack predictive guidance.
Missed Savings in Shipping Spend
Without consolidated carrier data, companies can't see:
- Which lanes carry inflated accessorial fees
- Which carriers are billing errors on 10% of invoices
- Where accessorial charges — which typically represent 20–35% of total parcel spend — have crept above sustainable levels
- Whether current contract rates still reflect market reality
These blind spots add up. Business Solutions Group's benchmark analyses show that companies completing a full shipping spend review identify savings ranging from 15% to 40%, with an average of 23.6% — recoverable cost that fragmented invoicing data had kept hidden.
Poor Inventory Decisions
Without a unified view connecting demand signals, supplier lead times, and stock levels, companies face two equally expensive outcomes:
- Overstock: Inventory carrying costs typically consume 20–30% of total inventory value annually
- Stockouts: Revenue losses from stockouts typically reach 2–5% annually in retail and consumer goods
Neither problem is easy to solve when inventory data, supplier performance records, and demand history live in separate systems that don't communicate.
Competitive Disadvantage
McKinsey research found that data-driven companies are 19 times more likely to be profitable than peers who don't. That's not a marginal edge — it's a structural one. As competitors build out analytics capabilities, organizations still working from fragmented data fall further behind with each planning cycle.
From Raw Data to Real Decisions: A 4-Step Framework
Turning fragmented data into actionable insights isn't a one-time project. It's a repeatable process. Here's how it works across four stages.
Step 1: Unify Your Data Sources
Unification means creating one coherent view of all relevant data streams — not necessarily a single massive database, but a connected layer that includes:
- Carrier invoices (parcel and freight)
- Procurement records and purchase order histories
- ERP exports and financial data
- Supplier performance metrics
- Warehouse and inventory records
BSG's platform consolidates these streams — integrating with ERP systems, WMS platforms, and carrier data sources — into a single automated reporting environment that replaces fragmented manual exports with continuous visibility across your operation.
Step 2: Cleanse and Standardize
Raw supply chain data is messy. Common problems include:
- Duplicate vendor records with inconsistent name formats
- Carrier invoice variations (same carrier, three different name spellings)
- Mismatched unit measures across systems
- Missing fields in historical purchase records
Data hygiene is unglamorous work — and non-negotiable. Every downstream insight is only as accurate as the data feeding it. Skipping this step means dashboards that look authoritative but mislead. Gartner found that poor data quality costs organizations an average of $12.9 million per year, much of it in decisions made from flawed inputs.
Step 3: Analyze for Patterns and Anomalies
Once data is unified and clean, analytics can surface what was previously invisible:
- Which carrier lanes have the highest cost-per-pound
- Which suppliers have the worst on-time delivery rates over the past six months
- Where safety stock thresholds are miscalibrated relative to actual demand
- Which spend categories are overdue for renegotiation
BSG's Parcel Spend Intelligence platform includes 25+ built-in actionable insights that automatically flag cost anomalies, billing errors, and optimization opportunities — cutting analysis time from weeks down to hours.
Step 4: Act — and Close the Loop
The final step is creating workflows where insights trigger decisions — because analysis that sits in a dashboard changes nothing:
- Renegotiating a contract after identifying above-market accessorial rates
- Shifting volume to a better-performing carrier on a specific lane
- Adjusting a reorder point after identifying safety stock miscalibration
- Flagging a supplier whose lead times have trended upward before it causes a stockout
Tracking whether those actions improved outcomes is the step most organizations skip. Done consistently, it's also what separates businesses that react to supply chain problems from those that stop them from recurring.
Key Data Sources Every Supply Chain Leader Should Unify
Most supply chains already generate the data needed to reduce costs and improve performance — it's just sitting in separate systems. Three data streams deliver the highest return when consolidated.
Shipping and Carrier Spend Data
US business logistics costs reached $2.58 trillion in 2024, per CSCMP's 2025 State of Logistics Report, with transportation as the single largest category. For most shippers, this is the highest-density source of recoverable cost. Key inputs include:
- Parcel and freight invoices
- Carrier rate cards and contract terms
- Accessorial charge histories
- Service failure and claims records
Procurement and Supplier Data
External spend accounts for 60–80% of total revenue in many businesses, making this one of the fastest paths to margin recovery. When unified, procurement data exposes sourcing concentration risk, contract gaps, and supplier performance drift before it reaches the network. Key inputs include:
- Purchase order histories and pricing trends
- Supplier lead times and on-time delivery rates
- Vendor performance scorecards
Inventory and Demand Data
Inventory inefficiency — overstock in one location, stockouts in another — is almost always a data visibility problem. Business Solutions Group's demand and inventory planning service, built on 250+ forecasting algorithms, connects these signals with supplier lead times to systematically eliminate both. Key inputs include:
- Stock levels by SKU and location
- Sales velocity and seasonal patterns
- Reorder histories and replenishment triggers
What Actionable Supply Chain Insights Actually Look Like
Consider two versions of the same finding.
A report says: "Freight spend increased 12% this quarter."
An insight says: "Freight spend increased 12% this quarter because three carriers on your Midwest lanes raised accessorial fees after Q1. Two of your existing contracted carriers have available capacity on those lanes at current rates — here's the volume shift that recovers the margin."
The difference is a clear next step attached to the finding.
Examples in Practice
Here's what that looks like concretely:
- Carrier damage rate on fragile SKUs: Spend data reveals one carrier consistently generates damage claims on a specific product category. Volume shifts to an alternate carrier. Damage costs and customer service overhead drop.
- Supplier lead time creep: Procurement data shows a key supplier's average lead time has extended from 14 days to 18 days over six months — without any formal notification from the supplier. Safety stock is adjusted before the first stockout occurs.
- Pareto spend concentration: Analysis shows 20% of SKUs account for 80% of shipping cost. Negotiations and service-level decisions concentrate on those SKUs rather than the full catalog.
The Advisory + Technology Combination
Business Solutions Group pairs proprietary spend intelligence technology with advisory teams — including former UPS, FedEx, and freight carrier executives — who translate findings into concrete negotiation strategies, contract revisions, or operational changes, then track whether outcomes actually improve. Surfacing an opportunity is only half the work; closing the loop on it is what separates insight from noise.
The benchmark analysis process requires minimal client time and has consistently identified 10–30% in savings opportunities for shippers who previously lacked unified visibility into their carrier spend.
Frequently Asked Questions
What is a fragmented supply chain?
A fragmented supply chain is one where data, processes, and visibility are siloed across disconnected systems and departments — ERPs, carrier portals, WMS platforms, and spreadsheets. No single team has a complete view, which leads to slower decisions, missed savings, and reactive operations.
What is the 80/20 rule in supply chain?
The Pareto Principle applied to supply chains means roughly 80% of costs, disruptions, or inefficiencies typically originate from 20% of sources — a small number of carriers, suppliers, or SKUs. Identifying that 20% focuses improvement efforts where they generate the greatest impact.
How do you turn supply chain data into actionable insights?
The four-step process: unify data from all relevant systems into one coherent view, cleanse and standardize it for accuracy, apply analytics to identify patterns and anomalies, then create decision workflows that translate findings into specific actions with measurable outcomes.
What are the biggest barriers to supply chain data integration?
The most common obstacles are legacy systems that don't communicate, inconsistent data formats across departments, lack of dedicated analytics capability internally, and no clear data ownership or governance strategy — all of which keep organizations reactive rather than proactive.
Will supply chain management be replaced by AI?
No. AI automates data processing and surfaces patterns faster than manual methods, but strategic decisions, supplier relationships, and operational judgment still require human expertise. Gartner projects widespread AI adoption in supply chain forecasting by 2030 — while explicitly cautioning against replacing human roles with AI alone.
What are the 7 C's of supply chain management?
The 7 C's are: Connect, Create, Customize, Coordinate, Consolidate, Collaborate, and Contribute. Each becomes far more achievable when supply chain data is unified across teams rather than siloed by system or department.