Introduction
Bid season puts every logistics team under pressure at once. Shippers are distributing RFPs across dozens of carriers and hundreds of lanes while carriers race to respond before capacity gets committed elsewhere. Both sides are negotiating against a clock — and once contracts lock in, those rates are fixed for the next 6–12 months.
The stakes are real. US business logistics costs reached $2.58 trillion in 2024 — roughly 8.8% of GDP — and freight procurement decisions directly affect how much of that spend your organization controls versus absorbs.
This guide covers what freight bid management is, the challenges that derail most procurement cycles, and a step-by-step process for running a smarter bid. It also covers the strategies that separate cost-optimized shippers from those quietly overpaying by double digits.
Key Takeaways
- Freight bid management is the structured process of soliciting, comparing, and awarding freight contracts across carriers and modes
- Key challenges include rate volatility, manual processes, non-standardized RFPs, and fragmented carrier data
- Following a structured bid process — from data prep through post-award monitoring — reduces cost exposure at every stage
- Technology and advisory partnerships cut cycle times and reduce the errors that lead to overpayment
What Is Freight Bid Management?
Freight bid management is the systematic process by which shippers — or their logistics partners — request, collect, compare, and award freight rates from carriers across modes: truckload, LTL, parcel, air, ocean, and rail.
Unlike ad hoc shipping decisions made at the point of need, it's a structured procurement function. It sits within a broader freight procurement strategy designed to control costs, secure capacity, and build carrier relationships that hold up when markets tighten.
Contracted vs. Spot Bids
Shippers work with two primary bid types, and each serves a different function:
- Contracted freight bids — negotiated in advance for a defined period (typically 6–12 months) on lanes with predictable, recurring volume. These provide rate stability and capacity assurance at the cost of flexibility
- Spot market bids — real-time quotes for immediate capacity needs on lanes where volume is irregular or a contracted carrier has declined a load. Spot is flexible but price-volatile
Under normal market conditions, spot freight accounts for roughly 20% of the truckload market. During the pandemic, that figure climbed to 50% before rebalancing. Your ideal mix depends on lane profile and how predictable your volumes actually are.
Freight Bid Management vs. Freight Management
Knowing which bid type fits your lanes matters — but so does understanding where bid management sits in your operation overall. These terms get used interchangeably, yet they describe different functions:
- Freight management — the full logistics operation: planning, carrier selection, execution, shipment tracking, and payment
- Freight bid management — specifically the procurement and rate-setting function within that broader operation
Conflating the two leads to under-resourcing the bid process. Teams end up treating rate procurement as a side task rather than a strategic function that needs dedicated attention and the right tools. That's a costly oversight when freight is one of your largest operating expenses.
Common Challenges in Freight Bid Rate Management
Rate Volatility
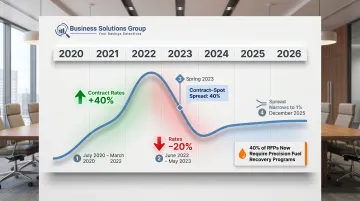
Freight rates don't sit still. Truckload contract rates jumped nearly 40% between July 2020 and March 2022, then fell at a record pace of nearly 20% between June 2022 and May 2023, according to FreightWaves. A shipper who locked in a 12-month contract at the 2022 peak found themselves paying far above market for the back half of their contract term.
Diesel adds another layer of exposure. At roughly 30% of a carrier's total operating costs, fuel price swings flow directly through to shipper invoices — diesel topped $5/gallon in both 2022 and early 2026. Fuel surcharge methodology has become a competitive dimension of the RFP, not a standardized pass-through.
Roughly 40% of shipper RFPs now mandate precision fuel recovery programs with lane-specific, daily-priced calculations rather than DOE-based surcharge schedules.
Manual Process Burden
Enterprise carrier bid analysis takes up to three weeks when managed through spreadsheets and email. Modern freight procurement platforms can compress that to approximately three days. The efficiency gap is significant enough on its own — but the accuracy problem is worse.
Research confirms that 94% of business spreadsheets contain critical errors. In freight procurement, those errors translate directly to misaligned bids, contract disputes, and overpayment. Despite this, 73% of freight procurement professionals are still not fully digitized, and half of procurement teams self-report ineffectiveness in managing freight procurement.
Inconsistent RFPs and Benchmark Blindness
Two related problems undermine most bid cycles:
- Non-standardized RFPs — generic templates produce bids that can't be compared across carriers because rate bases, accessorial definitions, and lane parameters don't align. Without apples-to-apples responses, evaluation becomes guesswork
- Benchmark blindness — mid-market shippers routinely overpay 8–15% on freight due to pricing blind spots and reliance on portfolio averages rather than lane-level data. Shippers who accept or reject bids without knowing current market rates are negotiating blind
Lane-level benchmarking alone can reveal 15–30% cost gaps hidden beneath national averages.
Risk Without Centralized Visibility
When bid management is scattered across business units, spreadsheets, and email threads, the risks stack up quickly: financial exposure from misapplied rates, missed SLA commitments when carrier performance goes untracked, and compliance gaps that only surface at audit. Without a centralized system, those problems are typically discovered after the damage is done.
How to Bid on Freight Contracts: A Step-by-Step Guide
Step 1: Compile and Cleanse Your Shipping Data
Before issuing any RFP, gather 12–24 months of historical shipment data: lanes, volumes, weights, dimensions, modes, and accessorial charges. Data quality determines bid quality — carriers price exactly what you tell them, so dirty or incomplete lane data produces equally dirty responses.
This phase is where Business Solutions Group's benchmark analysis begins: capturing 6–12 months of shipment-level detail to reveal what the network should actually cost, identify overpayment patterns, and set a measurable baseline before a single RFP goes out.
Step 2: Build a Freight-Specific RFP
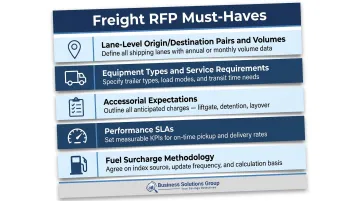
Generic procurement templates don't work for freight. A freight RFP must define:
- Lane-level origin/destination pairs and expected volumes
- Equipment types and service requirements
- Accessorial expectations (liftgate, residential, inside delivery, etc.)
- Performance SLAs (on-time delivery targets, tender acceptance rates)
- Fuel surcharge methodology preferences
Every element must be standardized across all carrier invitations. Inconsistent parameters produce incomparable responses, forcing your team to normalize data manually — and that defeats the purpose. With a clean RFP in hand, the next step is deciding who actually receives it.
Step 3: Identify and Qualify Carriers
Build your carrier shortlist by assessing:
- Lane coverage — does the carrier actually operate in the required lanes?
- Financial stability — at peak market stress in 2023, 80% of one-way truckload carriers operated at an OR above 100
- Safety ratings and compliance history
- Service performance — on-time delivery, claim rates, tender acceptance
Balance incumbent carriers with competitive alternatives. Incumbents know your freight; challengers create pricing pressure. Business Solutions Group maintains access to a network of over 20,000 vetted carriers across all modes, with an RFI pre-qualification step before any carrier enters the live bidding process.
Step 4: Evaluate and Compare Bids
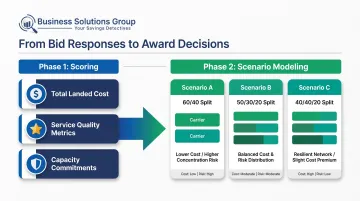
Normalize all responses before scoring. Carriers structure rates differently — per mile, per hundredweight, flat fee, zone-based — and comparing them without normalization produces false winners. Once normalized, score each carrier on:
- Total landed cost across your lane portfolio
- Service quality metrics (historical performance or committed SLAs)
- Capacity commitments and backup protocols
Run scenario modeling before committing. Awarding 60% of volume to a single carrier may look cost-effective on paper — until you factor in service failures or capacity gaps. Testing multiple award combinations reveals which allocation actually optimizes cost and coverage across your network.
Step 5: Negotiate, Award, and Establish Contract Terms
Competing bids are your best negotiating leverage — use them. Key negotiable line items include:
- Fuel surcharges — methodology, basis (DOE vs. daily wholesale), frequency of adjustment
- Accessorials — minimum charges, liftgate, residential delivery fees
- Rate escalation clauses — how and when rates can adjust mid-contract
- Volume commitments — what you owe the carrier if volume falls short
Once terms are finalized, document every agreed item explicitly. Ambiguity creates disputes post-award — carriers and shippers routinely recall verbal negotiations differently. Business Solutions Group negotiates all pricing directly in the client's company name — not as a broker — ensuring the shipper retains full ownership of the carrier relationship.
Proven Strategies to Optimize Your Freight Bids
Know the Market Before the First RFP Goes Out
Shippers who enter bid season without current lane-level benchmarks are negotiating blind. The market context matters: the contract-to-spot rate spread collapsed from roughly 40% in spring 2023 to just 1% by December 2025 — the narrowest gap in nearly four years. Shippers entering the 2026 bid season face fundamentally different pricing dynamics than those in recent cycles.
Business Solutions Group's benchmark analysis quantifies this gap directly — mapping what shippers of similar size and freight profile are actually paying — so you know your negotiating position before the first carrier conversation.
Centralize and Standardize
Decentralized bid management — different business units running their own processes, different RFP templates, carrier communications scattered across inboxes — produces inconsistent results and makes cross-cycle performance tracking nearly impossible. Centralization enables:
- Uniform RFP templates that produce comparable responses
- Consolidated carrier communications and relationship tracking
- Performance data that feeds directly into the next bid cycle
- Faster cycle times and fewer errors
Segment Your Freight Strategically
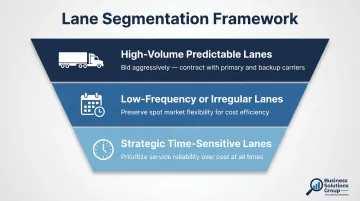
Not all lanes deserve the same bid strategy. Group lanes by volume, density, and strategic importance:
- High-volume, predictable lanes — bid aggressively for deep contract rates with primary and backup carriers
- Low-frequency or irregular lanes — preserve spot market flexibility rather than over-committing to contracted capacity
- Strategic lanes (time-sensitive, single-source suppliers) — prioritize service reliability over cost optimization
This prevents the common mistake of locking in contract commitments on lanes where volume doesn't materialize, which erodes carrier relationships and triggers minimum charge penalties.
Build Post-Award Monitoring Into the Process
Freight bid management doesn't end at contract signing. Carrier performance throughout the contract period should be tracked against agreed KPIs and fed into the next bid cycle. Key metrics to monitor include:
- On-time delivery rates
- Tender acceptance rates
- Damage and claims frequency
- Invoice accuracy
Carriers measured against contractual SLAs consistently post higher tender acceptance and fewer service failures than those operating without accountability.
Business Solutions Group's spend intelligence platform provides ongoing KPI tracking, monthly and quarterly business reviews, and re-benchmarking to confirm savings hold — and to identify mid-cycle renegotiation opportunities when market rates shift significantly.
Technology's Role in Modern Freight Bid Management
Purpose-built freight procurement platforms address the two biggest structural problems in manual bid management: time and accuracy.
Automated platforms handle RFP distribution, carrier response collection, rate normalization, and outlier flagging — compressing the evaluation cycle from three weeks to approximately three days. The accuracy improvement is just as significant as the speed. Manual processes rely on spreadsheets that contain errors in 94% of cases, and those errors compound across hundreds of lanes and dozens of carriers.
Scenario Modeling and What-If Analysis
Before committing to an award, shippers need to model the network impact of their decisions. What-if analysis tools allow procurement teams to:
- Test the total cost impact of awarding to different carrier combinations
- Identify network imbalances created by over-concentrating volume
- Model the cost/service tradeoff of primary vs. backup carrier splits
- Stress-test the bid outcome against different volume scenarios
Business Solutions Group's TMS platform includes scenario modeling functionality that applies optimization parameters against historical shipment data — giving procurement teams a sandbox to evaluate carrier routing strategies before going live.
Technology Adoption and Cost Outcomes
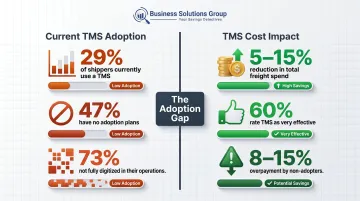
Despite clear ROI, only 29% of shippers currently use a TMS, and 47% have no plans to adopt one. TMS users report 5–15% reductions in total freight spend, and 60% describe their system as extremely or very effective at improving day-to-day operations. The adoption gap gives early movers a structural cost advantage. Shippers still running bids via spreadsheet typically overpay by 8–15% on freight that lane-level intelligence would have identified.
Business Solutions Group's eProcurement solution and spend intelligence platform connect benchmark data, carrier performance, and bid management into a single workflow — so shippers aren't pulling from three disconnected sources to make award decisions.
Frequently Asked Questions
How do you bid on freight contracts?
The process follows five core steps:
- Gather 12–24 months of shipment data
- Build a lane-specific RFP with standardized parameters
- Invite and pre-qualify carriers
- Normalize responses for apples-to-apples comparison
- Negotiate terms and issue awards
With proper tooling, the full cycle runs 6–10 weeks.
What is freight management in logistics?
Freight management is the full-cycle coordination of cargo movement — planning, carrier selection, execution, shipment tracking, and payment. Freight bid management is the narrower procurement function within that broader operation, focused specifically on rate-setting and carrier contracting.
What is a logistics management system?
A logistics management system (LMS) or TMS is software that helps companies plan, execute, and optimize freight movements. Most modern TMS platforms include bid board or RFP features that allow shippers to solicit, collect, and compare carrier bids in real time.
What is the difference between spot and contract freight bids?
Contract bids lock in rates for a defined period (typically 6–12 months) for lanes with predictable volume. Spot bids are one-off quotes for immediate capacity needs. Most shippers use both depending on lane frequency, volume consistency, and current market spread between contract and spot pricing.
How often should companies rebid freight contracts?
Most shippers rebid annually during a defined bid season (typically Q4–Q1). High-volume or strategically important lanes may warrant mid-cycle reviews when market rates shift significantly. The contract-spot spread collapsing from 40% to just 1% between 2023 and 2025 shows exactly what waiting for the annual cycle can cost.
What factors affect freight bid rates?
The main drivers are fuel costs, lane-level supply and demand, carrier capacity availability, shipment characteristics (weight, dimensions, mode), seasonality, and macroeconomic conditions. Carrier financial health — reflected in operating ratios — also affects rate behavior, particularly during prolonged market downturns.