Introduction
U.S. business logistics costs reached $2.3 trillion — equal to 8.7% of GDP, according to CSCMP's State of Logistics Report. Yet despite that scale, most organizations have surprisingly little control over what they're spending.
Gartner found that while 82% of CEOs in supply-chain-intensive industries plan to increase digital investment, fewer than half of supply chain leaders have a defined digital roadmap — and only 32% of those roadmaps operate under unified governance.
That gap is where budgets bleed.
The problem isn't the technology itself. Overspending happens because of the decisions made around it — how contracts get structured, how vendors get managed, and how little visibility exists into actual usage versus contracted capacity.
McKinsey estimates that digital indirect procurement solutions can enable 15% to 20% in cost savings, yet most organizations leave that potential untouched.
This article examines how IT costs accumulate, what drives them, and what specific strategies businesses can use to optimize spend and convert it into measurable ROI.
Key Takeaways
- IT costs accumulate through fragmented vendors, unused licenses, and unoptimized contracts — quietly compounding until they hit the budget hard
- The biggest cost drivers aren't the technology — they're the procurement decisions, contract structures, and governance gaps surrounding it
- Effective optimization starts with spend visibility: know exactly where money is going before deciding what to cut
- Optimization strategies span three areas — smarter upfront decisions, tighter operational management, and fixing the structural gaps around IT systems
- Businesses that treat cost optimization as an ongoing discipline consistently outperform those that treat it as a one-time fix
How IT Costs Build Up Across Business Operations
In supply chain and logistics environments, IT costs rarely show up as a single line item. They accumulate across carrier contracts, TMS subscriptions, analytics platforms, support services, and cloud infrastructure — often with no single owner tracking the total.
The Compounding Effect of Gradual Drift
The issue is rarely one large, obvious expense. It's dozens of smaller ones that each seem reasonable in isolation. Each vendor renewal, each under-negotiated contract, each underutilized platform adds a layer of overhead that goes unchallenged because no individual cost triggers an alarm.
The data on this is striking:
- 29% of SaaS spend is underutilized or wasted, according to Flexera's State of ITAM report covering 465 global IT professionals
- Flexera's 2026 State of the Cloud data shows wasted IaaS/PaaS cloud spend also reached 29%
- McKinsey estimates that technical debt alone equals 20% to 40% of the total technology estate value — and adds 10% to 20% to project costs on top
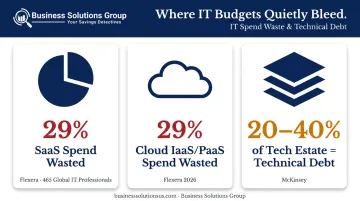
These aren't edge cases. They reflect how costs quietly compound when no one is tracking the full picture.
Discovery Usually Comes Late
Most businesses only surface the full scope of their IT overspending during a financial audit or formal spend review. By that point, costs have already compounded for months — sometimes years.
The pattern Business Solutions Group sees repeatedly: the largest savings opportunities don't come from new investments. They come from auditing what's already being paid for. That's where the most recoverable spend tends to hide.
Key Cost Drivers in IT-Enabled Business Operations
The cost profile of IT in supply chain and logistics is shaped by three forces: decisions made at procurement, how well technology use is governed over time, and how vendor relationships are managed (or neglected) after deployment.
Carrier Contracts and Freight Technology Agreements
Carrier contracts and freight-related technology agreements are among the most underoptimized spending categories. Freight market conditions shift continuously. The U.S. Bank Freight Payment Index reported that Q4 2024 shipments dropped 5.2% after modest Q3 growth, reflecting real market volatility.
Businesses that renew contracts at existing rates without benchmarking against current market pricing are accepting yesterday's terms in today's market.
That same failure to reassess applies to TMS investments. Gartner (2023) notes that logistics leaders frequently fail to capture the full value of TMS deployments, particularly in freight audit and settlement workflows where automation can convert outsourced processes into efficient internal operations.
Software Licensing and Cloud Misalignment
Software licensing structures and cloud service tiers are frequently out of sync with actual usage. Organizations often pay for capacity or features based on projected demand that never materialized. At the enterprise level, this isn't a minor issue — it's a structural cost leak.
Industry research (Zylo's 2023 SaaS Management Index) puts average SaaS waste at 29% of total spend. That figure reflects what happens when procurement decisions are based on anticipated scale rather than verified need, and no governance process triggers a reassessment.
Common sources of cloud and licensing waste include:
- Unused seats or features retained after team restructuring
- Auto-renewed contracts never reviewed against actual consumption
- Duplicate tools purchased across business units without central visibility
Governance Gaps Grow With Scale
Cost drivers shift depending on business maturity:
- For growing shippers: Early contract decisions dominate — commitments made before volume patterns were clear often lock in unfavorable terms
- For established operations: Governance gaps and lack of real-time spend visibility become the primary driver — costs drift because no one has accountability for tracking them
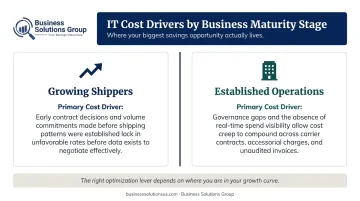
This variability is why a one-size-fits-all cost reduction approach rarely works. Identifying the right lever — contract renegotiation, licensing audit, or governance restructuring — depends on where the organization actually sits in its growth curve.
Cost-Reduction Strategies for IT Cost Optimization
Effective IT cost optimization requires matching strategies to where costs actually originate. Solutions targeting the wrong lever produce minimal results. The three categories below address procurement decisions, management practices, and structural factors — each targets a distinct source of waste.
Strategies That Reduce Costs by Changing Decisions
Prevention is the highest-leverage point — these strategies stop waste before it enters the budget.
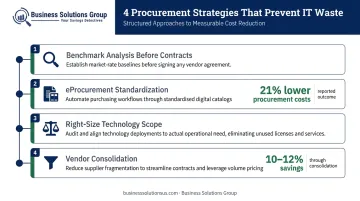
Conduct benchmark analysis before signing or renewing contracts. Many businesses sign without knowing whether pricing is competitive. Benchmarking against market rates — using tools like Business Solutions Group's proprietary spend intelligence platform — gives organizations the data to negotiate from strength. BSG's team, which includes former UPS and FedEx senior pricing analysts, applies this methodology across parcel, LTL, and freight agreements.
Adopt eProcurement solutions to standardize purchasing. Unstructured procurement creates shadow spending and inconsistent vendor pricing. According to Hackett Group's 2024 benchmark, Digital World Class procurement functions cost 21% less to deliver and process 81% more indirect spend through electronic catalogs. eProcurement enforces policy and eliminates ad hoc purchasing that inflates costs.
Right-size technology scope during procurement. Over-specification — purchasing more capacity, features, or coverage than needed — is one of the most common procurement errors. Build realistic usage projections into vendor selection to avoid paying for unused capacity.
Consolidate vendors to reduce fragmentation costs. Managing multiple vendors for overlapping functions creates administrative overhead and missed volume discounts. McKinsey found analytics-led vendor consolidation delivered 10%–12% savings by identifying service overlaps and rationalizing supplier bases.
Strategies That Reduce Costs by Changing How IT Investments Are Managed
Even well-negotiated contracts lose value without active governance. These strategies close the gaps that let costs drift upward after initial deployment.
Implement continuous spend monitoring. Without real-time visibility into usage, invoices, and contract performance, overspending compounds undetected. Best-in-Class procurement organizations manage 91.7% of enterprise spend versus 61.1% for average organizations — that 30-point gap is direct savings leakage.
Conduct regular IT audits to surface unused licenses and underutilized assets. Periodic audits — not just annual reviews — expose software licenses, cloud instances, and contracted services paid for but never used. These are often the fastest wins available. One Flexera case study found renewal reductions of 15% on Adobe and 12% on Microsoft following a structured license audit.
Assign cost ownership across departments. Central IT management without cross-functional accountability gives individual teams no incentive to reduce consumption. Departmental ownership creates internal pressure to use resources efficiently.
Establish ROI benchmarks and track performance continuously. Without defined success metrics, IT investments can silently erode margins. Connecting spend to operational outcomes — cost per shipment, cost per transaction, carrier performance KPIs — makes the ROI conversation concrete and ongoing.
Strategies That Reduce Costs by Changing the Context Around IT Operations
Some inefficiency is structural — built into the architecture of how IT operates. These strategies address the root conditions, not just the symptoms.
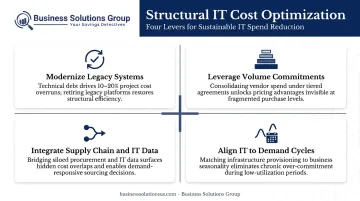
Modernize or exit legacy systems. McKinsey research shows technical debt adds 10%–20% to project costs and diverts the same share of new-product budgets to debt remediation. Legacy infrastructure demands disproportionate maintenance spend, creates integration friction, and locks organizations into outdated vendor relationships. In many cases, the cost of modernization is lower than the ongoing cost of maintaining legacy infrastructure.
Leverage volume and scale commitments for better pricing. Businesses that negotiate individually by product or service miss the advantages available through aggregated volume commitments. In freight and parcel shipping especially, even modest consolidation can unlock significantly lower pricing tiers.
Integrate supply chain and IT data to eliminate redundant systems. Siloed environments lead organizations to maintain parallel platforms for overlapping functions — separate tools for inventory, shipping, and reporting that could run as one integrated stack. Consolidating these data flows reduces duplication and lowers the overall technology footprint.
Align IT investment cycles with actual demand patterns. Many businesses experience seasonal or cyclical demand but provision IT resources for peak usage year-round. Timing upgrades, renewals, and capacity expansions to match real demand cycles cuts unnecessary spend during low-utilization periods.
Conclusion
Maximizing ROI from IT cost optimization isn't about cutting spend across the board. It requires identifying where costs originate (whether in procurement decisions, management gaps, or structural dependencies) and applying the right strategy to each root cause.
The businesses achieving the strongest returns treat this as a continuous, data-driven discipline. They audit regularly, benchmark before every renewal, monitor spend in real time, and connect every dollar of IT investment to a measurable operational outcome.
Working with the right advisors accelerates that path. Business Solutions Group brings benchmark data, spend intelligence tools, and end-to-end supply chain expertise to businesses across parcel, freight, and logistics — identifying concrete, measurable savings opportunities, often without requiring a change in carriers or operations. We operate on a contingency-based model: no fee unless savings are found, which makes the initial engagement low-risk.
If you're not benchmarking your current contracts and monitoring spend in real time, the gap between what you're paying and what you should be paying is almost certainly wider than it looks.
Frequently Asked Questions
What does IT cost optimization mean for supply chain and logistics businesses?
IT cost optimization in this context means systematically reducing total spend on technology platforms, carrier contracts, and operational tools while maintaining or improving performance. The focus is on aligning every dollar spent to a measurable business outcome, turning cost reduction directly into margin.
How do you calculate ROI from IT cost optimization solutions?
ROI is calculated by comparing total savings achieved, including cost avoidance, against the investment made in optimization tools, advisory services, and internal effort. The calculation should account for both direct savings and indirect gains such as reduced administrative overhead and improved contract compliance.
What are the most common hidden IT costs in business operations?
The most frequently overlooked cost areas are unused software licenses, auto-renewing vendor contracts at non-competitive rates, underutilized cloud or platform capacity, and unoptimized carrier agreements. These rarely surface without a structured spend audit.
How long does it typically take to see ROI from IT cost optimization?
Quick wins from audits and contract renegotiations often appear within weeks. More systemic improvements from procurement restructuring and spend intelligence adoption generally deliver measurable ROI within three to six months, depending on contract cycle lengths and organizational complexity.
What is spend intelligence and how does it reduce IT costs?
Spend intelligence uses data and analytics tools to give organizations full visibility into vendor spend, contract terms, and operational costs. It surfaces waste, supports data-backed negotiations, and enables cost decisions before problems compound.
How can benchmark analysis help businesses reduce IT and operational costs?
Benchmark analysis compares a business's current pricing and contract terms against market standards, identifying where they're overpaying and providing the evidence needed to renegotiate. Without it, most businesses have no reliable way to know whether their rates are competitive.