Introduction
Gartner forecast worldwide IT spending to reach $5.61 trillion in 2025, up 9.8% year over year. Yet higher spending rarely translates into more value. According to BCG, only 30% of large-scale technology programs are delivered on time, within budget, and within scope.
Spending decisions made without visibility, governance, or clear alignment to business outcomes drive the gap. The consequences are predictable: margin pressure, budget overruns, and IT teams consuming capacity on unplanned work instead of strategic priorities.
This article is for IT and business leaders ready to treat cost discipline as a structural capability, not a one-time exercise. We'll walk through three strategic levers: how IT costs are decided, how they are managed, and how the organizational context around them either amplifies or reduces waste.
Key Takeaways
- IT costs compound gradually through layered decisions — trace origins before applying reductions
- The biggest drivers are underutilized assets, poor procurement governance, cloud sprawl, and technical debt
- Effective optimization targets decisions, day-to-day management, and structural context — not just line-item cuts
- Peer benchmarking quickly surfaces where spend is misaligned with actual business value
- Sustainable savings require continuous governance cycles, not one-time audits
How IT Costs Typically Build Up
IT costs rarely appear as one large budget line. They accumulate through hundreds of small decisions made across teams, time periods, and procurement cycles — often without centralized tracking.
The pattern is gradual and compounding:
- A SaaS license added to solve a departmental problem
- A cloud instance spun up for a project and never decommissioned
- An aging on-premise system kept running because migration feels disruptive
- A vendor contract auto-renewed without a usage review
Each decision adds marginal cost. Over time, that cost becomes structural and harder to remove without operational disruption.
The harder problem is visibility. Most of these costs go undetected until an audit, a budget crisis, or a scaling event forces a reckoning — by then, the cost base has already hardened. Shadow IT alone accounted for 51% of SaaS applications in organizations as of 2023, purchases made entirely outside IT's visibility.
That's why effective cost optimization begins with a diagnostic — mapping where spend originated before deciding what to cut.
Key Cost Drivers for IT
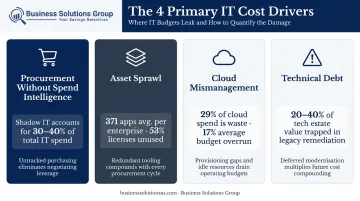
IT cost profiles are shaped by four primary drivers. Understanding which one dominates your organization is the first step to targeted action.
Procurement Decisions Made Without Spend Intelligence
When buyers lack visibility into what's already been purchased, they buy redundantly. Without approved vendor catalogs or purchasing policies, tool selection defaults to convenience rather than cost efficiency. Tail spend and shadow IT build up undetected — each individual purchase seems minor until they aggregate into a substantial budget line.
Asset Sprawl: Licenses, Tools, and Infrastructure
The average organization now manages more than 371 SaaS applications, and 53% of SaaS licenses go unused over any given 90-day period. At $9,600 in average SaaS spend per employee annually, that unused capacity adds up to a recoverable cost most organizations haven't quantified.
Over-provisioned compute and storage infrastructure follows the same pattern — resources provisioned for peak demand that rarely arrives.
Cloud Cost Mismanagement
Cloud environments are unusually hard to contain. Spinning up resources is frictionless; decommissioning is not. The result: 29% of IaaS and PaaS cloud spend is estimated to be wasted, according to the Flexera 2026 State of the Cloud Report. Cloud budgets exceed planned limits by an average of 17%, and 84% of organizations identify managing cloud spend as their top cloud challenge.
Technical Debt
McKinsey estimates technical debt equals 20–40% of the entire technology estate's value before depreciation. Organizations spend 10–20% of new product technology budgets just resolving issues created by deferred maintenance. Legacy systems require disproportionate support, introduce security vulnerabilities, and block modernization efforts.
No two organizations share the same cost profile. Before building a reduction strategy, identify which driver is consuming the most — cloud waste, SaaS sprawl, or technical debt — because each requires a different intervention.
Cost-Reduction Strategies for IT Leaders
The most effective optimization strategies address costs at their source. The framework below organizes strategies by where they intervene: before spending is committed, while systems are active, or at the organizational level that shapes all cost decisions.
Strategies That Change Decisions (Upstream)
These approaches reduce IT cost by improving the quality of decisions made before budgets are finalized or contracts are signed.
Benchmark IT spend against peers before finalizing budgets. Many IT leaders approve annual budgets without knowing whether their cost structure aligns with industry norms. Gartner's IT Budget and Efficiency Benchmark lets CIOs compare budget and staffing plans with peer organizations to assess true cost, efficiency, and strategic alignment. Business Solutions Group's comprehensive benchmark analysis capability helps leaders contextualize their IT procurement spend against relevant industry peers, identifying categories where they're over-investing and surfacing opportunities to reallocate.
Conduct software and license audits before renewals. Most organizations renew SaaS licenses automatically, without reviewing actual utilization data. With 53% of licenses unused in a typical 90-day window, auditing usage before each renewal cycle prevents significant recurring overpayment. The data exists — the discipline to act on it before auto-renewal is usually what's missing.
Standardize procurement policies and approved vendor lists. Without purchasing guardrails, buyers select vendors based on familiarity rather than value. Establishing approved catalogs before purchase decisions are made prevents tail spend accumulation and reduces shadow IT. This is a decision-stage control, not a post-purchase audit.
Right-size infrastructure provisioning during planning. Over-provisioning is a persistent planning failure. Allocating compute, storage, and cloud resources against actual workload requirements — rather than theoretical peaks — reduces committed spend before it becomes locked in.
Strategies That Change How IT Is Managed (Midstream)
These approaches address costs that have already been committed but aren't being managed efficiently.
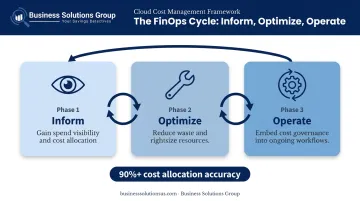
Implement FinOps practices to create shared cloud cost ownership. FinOps aligns IT, Finance, and business stakeholders around cloud cost accountability through three iterative phases: Inform (visibility into spend), Optimize (reducing waste and rightsizing), and Operate (embedding cost governance into ongoing workflows).
IDC estimates 20–30% of all cloud spending is wasted. FinOps directly targets that gap. Organizations at the FinOps Foundation's "Run" stage achieve over 90% cost allocation accuracy and less than 5% forecast variance.
Establish centralized spend visibility across IT procurement categories. When IT and procurement leaders lack a unified view of what's being purchased, by whom, and at what cost, problems surface only after the fact. Business Solutions Group's proprietary spend intelligence software provides category-level visibility that enables leaders to identify redundant spend, renegotiate contracts proactively, and enforce purchasing governance before costs compound.
Automate routine IT operations. Manual patching, provisioning, and monitoring absorb IT team capacity that could be redirected to higher-value work. Automation reduces both direct labor costs and the indirect cost of downtime caused by delayed or inconsistent maintenance cycles.
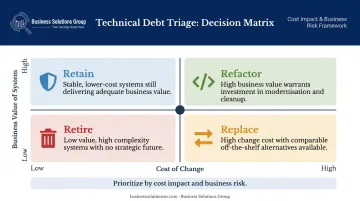
Address technical debt systematically, not selectively. Technical debt compounds. Deferring it doesn't reduce its cost ; it increases it. This triage framework, adapted from Microsoft's 6 Rs of application modernization, organizes legacy systems into four actions:
| Action | When to Apply |
|---|---|
| Retire | System no longer needed; decommission entirely |
| Replace | Replace with a modern, lower-maintenance alternative |
| Refactor | Modernize the codebase to extend useful life |
| Retain | Keep as-is where cost of change exceeds benefit |
Prioritizing by cost impact and business risk ensures resources go where the return is highest.
Strategies That Change the Context Around IT (Structural)
These approaches reduce IT cost by modifying the organizational or structural factors that inflate costs regardless of how well individual systems are managed.
Four structural levers consistently drive durable cost reduction at the organizational level:
- Build or mature a Cloud Center of Excellence (CCoE). Without centralized cloud governance, individual teams create sprawl, duplicate capability, and inconsistent security posture. A CCoE standardizes architecture decisions and prevents cost-inflating patterns before they scale. Flexera's 2026 data shows 71% of organizations now operate a CCoE, up meaningfully from prior years.
- Conduct an IT workforce assessment. Workforce costs are a significant share of IT budgets, and organizational structures drift out of alignment with actual technology needs over time. A structured role and skills assessment identifies redundancy, outsourcing opportunities, and reskilling priorities.
- Consolidate vendor relationships. Concentrating spend volume with fewer vendors enables better pricing, stronger SLAs, and lower procurement management overhead. Forrester found that organizations consolidating multiple disconnected procurement tools reduced operating costs by 30%, with payback in under six months.
- Align IT cost optimization with Finance and Operations. IT cost decisions made in isolation frequently fail to hold. When IT, Finance, and Procurement share data, reporting structures, and optimization goals, reductions are far more likely to persist beyond the next budget cycle or leadership change.
Conclusion
Sustainable IT cost optimization starts with understanding where costs originate — distinguishing structural spend from avoidable waste, then acting on each with the right approach.
Leaders who achieve lasting results treat optimization as an ongoing discipline, not a one-time project. That means building governance structures, consistent measurement, and cross-functional accountability into how IT is managed day to day.
The goal is not a smaller IT budget. It's one allocated precisely enough that every dollar either reduces risk, supports operations, or funds the capabilities that move the business forward.
Frequently Asked Questions
What is the difference between IT cost optimization and IT cost cutting?
Cost cutting reduces spend without regard for value or consequences. Cost optimization identifies waste, improves efficiency, and reallocates savings toward higher-priority investments. The goal is to reduce unnecessary cost without degrading performance, capability, or the organization's ability to grow.
What are the most commonly overlooked sources of IT cost waste?
Shadow IT, unused or duplicate SaaS licenses, over-provisioned cloud resources, and deferred technical debt are the most frequently missed. These costs rarely appear in standard budget reviews — they typically surface only through a formal spend analysis or asset audit.
How should IT leaders prioritize which costs to address first?
Start with the highest-impact, lowest-risk reductions: unused licenses and redundant subscriptions. Then move to more structural changes like cloud rightsizing and technical debt remediation. Benchmarking against peer organizations helps identify where your cost structure is farthest out of alignment.
What role does benchmarking play in IT cost optimization?
Benchmarking compares your IT spend structure against relevant industry peers, revealing where costs are unusually high, where value is being missed, and where investments may be underfunded. Internal analysis alone can't provide that external reference point.
How can IT leaders align cost reduction with business growth objectives?
Frame optimization as a reallocation strategy, not a reduction exercise. Redirect savings from eliminated waste toward innovation and strategic projects. Involving Finance and business unit leaders in the process ensures cost decisions support growth rather than constrain it.
What metrics should IT leaders track to measure optimization success?
Key KPIs include:
- IT spend as a percentage of total operating expense
- Cloud cost waste ratio — Flexera benchmarks wasted IaaS/PaaS spend at ~29%
- SaaS license utilization rate — industry average is ~47% active over 90 days
- Maverick spend as a percentage of total off-policy purchasing
- Forecast variance — FinOps maturity target is under 5%