Introduction
Most logistics operations aren't short on data. Shipment histories, inventory records, carrier invoices, and order files stretch back years — yet stockouts still happen, emergency freight gets booked at premium rates, and warehouse labor gets scheduled wrong.
The gap is in how that data gets used. Historical patterns rarely translate into forward-looking operational choices until after problems have already hit.
Demand forecasting in logistics is the process of using historical data, market signals, and statistical models to predict future freight volumes, inventory needs, and carrier capacity requirements. Done well, it shifts planning from reactive to proactive.
This article covers how demand forecasting works in logistics, what inputs and methods it relies on, what degrades its accuracy, and where it most commonly fails — giving you a practical framework for converting data into decisions that actually reduce costs.
Key Takeaways
- Demand forecasting predicts future shipment volumes, inventory needs, and freight capacity requirements using historical data and statistical models
- Poor forecasting directly inflates carrier costs — 49% of all expedite events stem from inaccurate demand forecasts, per APQC data
- Four phases drive the process: data collection, model selection, forecast generation, and operational execution
- Data quality and integration are bigger accuracy determinants than model sophistication
- A forecast only delivers value when it drives a specific operational decision
What Is Demand Forecasting in Logistics?
Demand forecasting in logistics is distinct from general business demand forecasting. Where a sales team forecasts units sold, logistics demand forecasting predicts the shipment volumes, timing, routing patterns, and origin-destination flows — the inputs that drive freight capacity planning, carrier contracts, warehouse staffing, and inventory positioning.
Demand Forecasting vs. Predictive Analytics
The two terms overlap but serve different functions:
- Demand forecasting is a specific application: estimating future freight or product volumes using historical data and models
- Predictive analytics is the broader discipline — it includes demand forecasting but also covers route optimization, carrier risk scoring, and real-time disruption detection
Demand forecasting feeds into a larger predictive analytics ecosystem. Organizations that conflate the two often discover the gap when a disruption hits and their forecasting models can't substitute for real-time execution intelligence.
Two Categories of Forecasting Methods
Quantitative methods use structured historical data to model patterns:
- Time series analysis (moving averages, ARIMA/SARIMA)
- Regression models that connect demand to external drivers
- Machine learning models for complex, multi-variable patterns
Qualitative methods fill gaps where clean data doesn't exist:
- Expert judgment from operations or sales teams
- Market intelligence from carriers or trade partners
- Customer input for new product launches or new freight lanes
Most mature logistics operations use both. Quantitative methods serve as the primary input where data is clean and complete; qualitative judgment covers the gaps — new lanes, new products, or markets with limited history.
Why Demand Forecasting Matters in Logistics Operations
The Cost of Getting It Wrong
The financial case for forecasting is straightforward. The penalties for poor forecasting are measurable.
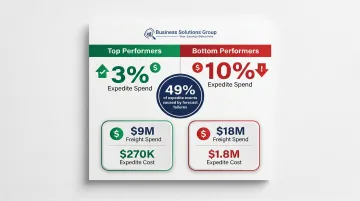
According to APQC benchmarking data, top-performing supply chains limit expedited freight spend to 3% of their total logistics budget. Bottom performers spend as much as 10%. For a business running $9 million in annual freight costs, the gap between a 3% and 7% expedite rate is roughly $360,000 per year. At $18 million in freight spend, it exceeds $700,000 annually.
The same APQC research found that 49% of all expedite events are caused by inaccurate demand forecasts — not carrier failures, not market conditions, not weather. Planning failures.
Meanwhile, inventory carrying costs typically run 15–30% of total inventory value annually. Overstocking compounds the problem from the other direction: capital tied up in the wrong inventory, occupying warehouse space, generating costs without generating revenue.
Smarter Carrier Procurement
When a business knows its freight volume trends weeks or months ahead, it can:
- Negotiate contract rates from a position of credible volume data
- Avoid spot market exposure during peak periods
- Build committed capacity with preferred carriers before demand spikes
The cost difference matters. Spot truckload rates rose 23.3% year-over-year in recent data while contract rates rose only 5% over the same period. Shippers pushed onto the spot market by forecast failures face a rate environment where the premium for reactive buying is steep and widening.
This is where forecast data becomes a direct input to carrier procurement. Business Solutions Group builds carrier contract negotiations on shipment data analysis and market benchmarking — giving clients the volume history and pattern clarity that carriers actually respond to at the negotiating table.
Operational Planning Benefits
Accurate freight demand forecasts enable a chain of proactive decisions:
- Warehouse managers schedule labor before volume arrives, not in response to it
- Inbound and outbound capacity is planned against projected demand curves
- Purchase orders align with realistic supplier lead times and freight availability
These decisions compound quickly. A planning failure early in the cycle triggers a cascade: emergency staffing, reactive carrier bookings, and inventory corrections that each carry a higher price tag than getting the forecast right would have.
How Demand Forecasting Works: From Data to Decision
The forecasting process is an end-to-end workflow. It starts with data aggregation, moves through model selection, produces forecast outputs, and ends with those outputs being translated into operational decisions. The forecast is only as useful as the action it enables.
Step 1: Data Collection and Integration
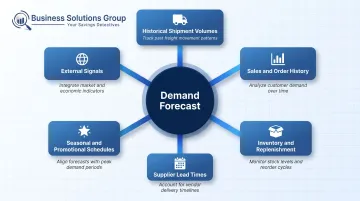
Effective logistics demand forecasting draws from multiple sources:
- Historical shipment volumes by lane and carrier
- Sales and order history tied to shipment events
- Inventory levels and replenishment cycles
- Supplier lead times and purchase order history
- Seasonal calendars and promotional schedules
- External signals: economic indicators, weather patterns, market trends
The most common failure at this stage is data silos. When ERP, WMS, and TMS systems aren't connected, each holds a partial picture. 62% of supply chain leaders identify data silos as their biggest barrier to effective decision-making. Business Solutions Group's TMS integrates directly with WMS and ERP systems, consolidating shipment data into a single reporting environment — a prerequisite before any forecasting model can perform reliably.
Data quality matters more than data volume. Incomplete records, inconsistent lane coding, and missing carrier data will systematically undermine any model. Get the data infrastructure right first — forecasting tools are only as good as what feeds them.
Step 2: Model Selection and Analysis
Model choice should match data maturity, not aspirations. A straightforward time series model on clean, connected data outperforms a machine learning model on fragmented inputs.
| Method | Best For |
|---|---|
| Moving averages / ARIMA | Stable demand with seasonal patterns |
| Regression models | Demand driven by external variables (promotions, economic conditions) |
| Machine learning (random forest, gradient boosting) | Complex, multi-variable patterns with large, clean datasets |
| Qualitative / expert judgment | New lanes, new products, limited historical data |
One practical note: traditional exponential smoothing methods tend to fail during demand disruptions by treating abnormal periods as normal patterns. Models need to account for shocks explicitly — not smooth through them — to remain useful during volatile periods.
Step 3: Forecast Generation and Translation Into Decisions
Most organizations produce a forecast, circulate it as a report, and move on. The forecast never connects to a decision — and the value evaporates.
Forecast outputs — projected volume by time period, lane, or SKU — must connect to specific operational actions:
- A projected 20% freight volume increase in Q4 should trigger early carrier rate negotiations, adjusted warehouse staffing, and pre-positioned inventory
- A projected lane volume decline should inform contract restructuring before renewal
- A projected demand spike for a specific SKU should adjust reorder points and inbound scheduling
Clear ownership and timelines are non-negotiable. Business Solutions Group's advisory process connects forecast data to carrier procurement strategy and spend optimization, turning projections into concrete cost savings rather than slide deck footnotes.
Key Factors That Affect Demand Forecasting Accuracy
Data Quality and Integration
Data quality is the single largest determinant of forecast accuracy. Poor data costs organizations an average of $12.9 million per year according to Gartner research, and 43% of chief operations officers cite data quality as their most pressing data priority.
AI and machine learning models inherit and amplify whatever data problems already exist. No algorithm compensates for bad inputs — so the data foundation has to come first.
Seasonality and Predictable Variability
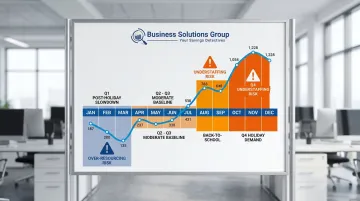
Seasonal demand fluctuations — Q4 holiday freight, agricultural harvest cycles, back-to-school periods — create structured variability that must be explicitly built into forecasting models. This variability is predictable when historical data is properly segmented by season and event type.
Logistics operations that fail to account for recurring seasonal patterns consistently end up mis-scheduling capacity — understaffed during peaks and over-resourced during slow periods.
External Disruptions
No model eliminates uncertainty. Supply chain shocks, geopolitical shifts, fuel price swings, and carrier capacity constraints introduce variables that historical patterns can't fully capture.
A forecast's job isn't to predict these events. Its job is to establish a clear baseline so that deviations become visible faster. When actual volumes diverge sharply from forecast, teams know immediately to investigate — rather than discovering the problem after the damage is done.
Key disruption signals worth monitoring:
- Sudden carrier capacity tightening in a lane
- Fuel surcharge spikes that shift shipper behavior
- Geopolitical events affecting cross-border freight volumes
Forecast Horizon
- Short-horizon forecasts (days to weeks): More accurate, with limited lead time to act on findings
- Long-horizon forecasts (months to quarters): Greater planning runway, but carry wider uncertainty bands
Logistics teams should maintain rolling forecasts updated regularly rather than relying on a single annual or quarterly projection. Static forecasts become outdated quickly in a market where freight conditions shift on short timelines.
Common Pitfalls in Logistics Demand Forecasting
More Data and More AI Don't Automatically Mean Better Forecasts
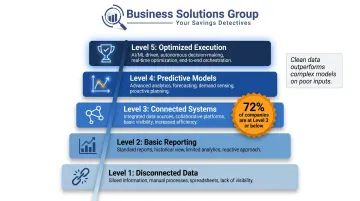
This is the most pervasive misconception. The bottleneck in most logistics organizations isn't model sophistication — it's data quality and process discipline. Gartner data shows 72% of companies with physical supply chains operate at Level 3 or below in planning maturity, meaning most haven't yet achieved the basics of connected, clean data before considering advanced models.
A well-maintained time series model on clean data will consistently outperform a machine learning model on fragmented, inconsistent inputs. Model selection should follow data maturity — not aspirations.
The "Forecast as Report" Failure Mode
Generating a forecast and distributing it without connecting it to specific decisions is a cost with no return. Forecasting only creates value when outputs are tied to:
- Carrier negotiations with assigned timelines and accountable owners
- Inventory positioning decisions tied to specific SKUs and locations
- Warehouse staffing plans with defined volume trigger thresholds
Three in five companies report dissatisfaction with how well their planning objectives align with actual capabilities. The gap isn't analytical — it's operational. Forecasts exist, but decisions don't follow.
When Forecasting Isn't the Right Tool
Statistical forecasting has real limitations in specific scenarios:
- New freight lanes or product launches with no historical data make quantitative models unreliable
- Highly irregular or lumpy demand (project freight, one-time shipments) is better managed through scenario planning and safety stock buffers
- Very short lead-time environments may benefit more from demand sensing — reacting to real-time signals — than from medium-range statistical forecasts
In these cases, the right call is to identify which decision actually needs to be made — and choose the tool that serves it, not the one that looks most sophisticated.
Frequently Asked Questions
What is demand forecasting in logistics?
Demand forecasting in logistics uses historical shipment data, market signals, and statistical models to predict future freight volumes, inventory requirements, and carrier capacity needs. The goal is proactive planning — positioning capacity, negotiating contracts, and staging inventory before problems occur rather than after.
What are the main tools for demand forecasting?
Tools range from ERP-native planning modules and standalone demand planning platforms to machine learning frameworks for complex pattern detection. TMS and WMS integrations connect forecast outputs to execution. The right tool depends on your data maturity — clean, well-structured data will outperform sophisticated models built on poor inputs every time.
How is data analytics used in logistics?
Data analytics in logistics spans three layers: descriptive (what happened), predictive (what will happen), and prescriptive (what to do about it). Demand forecasting is the predictive layer — translating historical patterns into forward-looking volume and capacity estimates that drive procurement and operational decisions.
What's the difference between demand forecasting and predictive analytics?
Demand forecasting is a specific application focused on estimating future freight or product volumes. Predictive analytics is the broader discipline that also includes route optimization, carrier risk scoring, and real-time disruption detection. Demand forecasting is one important input within a larger predictive analytics ecosystem.
What are the most common challenges with demand forecasting in logistics?
Three challenges come up consistently:
- Data quality: Siloed or inconsistent data undermines model accuracy regardless of how sophisticated the tool is
- Accountability gaps: Forecast outputs that aren't connected to clear ownership rarely drive action
- Volatility blind spots: Historical models alone don't fully account for seasonal swings or external disruptions