A business processing $40,000 per month at 2.5% pays $12,000 annually in fees. At 2.2%, that same business pays $10,560. A 0.3-point difference compounds to $1,440 per year—without a single additional sale. Multiply that across higher-volume merchants, and the impact on margins becomes material fast.
Most merchants assume their advertised headline rate reflects what they actually pay. It rarely does. The real figure—the effective rate—is higher once monthly account fees, gateway charges, PCI non-compliance penalties, and chargeback costs are factored in.
This guide covers how merchant fees accumulate, what drives them, and how to reduce costs across three dimensions: decisions made before processing begins, how fees are managed while the account is active, and the broader payment environment the business operates in.
Key Takeaways
- Your true effective rate runs higher than the quoted 2%–3.5% once all fees are counted.
- Interchange variability, pricing model structure, and ancillary fees are the three biggest cost drivers.
- Switching to interchange-plus pricing is the single most impactful structural change available to most established merchants.
- Calculate your effective rate monthly, not annually, to catch fee creep early.
- Peer benchmarking is the most powerful starting point for any cost-reduction effort.
How Merchant Processing Fees Build Up Over Time
Merchant fees don't arrive as one visible line item. They accumulate across every transaction, every billing cycle, and every edge case your processor charges for—driving up your total cost month after month without a single line item flagging it.
The Two Patterns of Cost Build-Up
Fees accumulate in two distinct ways simultaneously:
- Gradual base costs — Per-transaction fees that scale directly with volume. These are predictable but often underestimated because merchants focus on the percentage, not the compounding effect over 12 months.
- Episodic spikes — One-time or irregular charges triggered by chargebacks, PCI non-compliance flags, or interchange downgrades from incomplete transaction data. These are invisible until a detailed statement review reveals them.
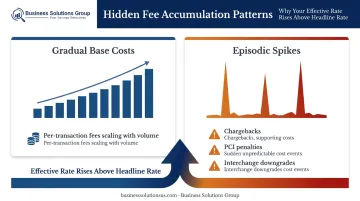
Both patterns work together to push your effective rate above what you were quoted. That's where the headline rate starts to mislead.
The Gap Between Headline Rate and Effective Rate
Here's a straightforward illustration of why the headline rate misleads:
| Monthly Volume | Headline Rate | Annual Fees | Effective Rate (with $50/mo fixed fees) |
|---|---|---|---|
| $40,000 | 2.2% | $10,560 | ~2.35% |
| $40,000 | 2.5% | $12,000 | ~2.65% |
Fixed monthly charges—account fees, gateway fees, statement fees—don't scale with volume. At lower volumes, they inflate the effective rate significantly. Most merchants operate on the assumption that the advertised rate reflects their true cost. The effective rate—calculated as total fees ÷ total card sales volume—is almost always higher, sometimes by 15–25 basis points or more once fixed fees are factored in.
Key Cost Drivers for Merchant Fees
Merchant fees don't come from a single source — they stack from three distinct cost drivers, each requiring a different strategy to control.
Interchange Variability
Interchange is the largest underlying cost in any processing statement—and it's set by card networks, not processors. According to Mastercard's April 2024 interchange schedule, the spread across card types and transaction methods is substantial:
| Card Type | Transaction Method | Rate |
|---|---|---|
| Consumer Core | Card-present (Small Ticket) | 1.65% + $0.02 |
| Consumer World Elite | Card-present (Small Ticket) | 2.30% + $0.02 |
| Consumer Core | Key-entered / Card-not-present | 1.95% + $0.10 |
| Consumer World Elite | Key-entered / Card-not-present | 2.60% + $0.10 |
| Commercial Business Core | Data Rate I (standard) | 2.65% + $0.10 |
| Commercial Business Core | Data Rate II (enhanced data) | 1.90% + $0.10 |
The difference between a chip-present Core transaction and a key-entered World Elite transaction is nearly a full percentage point—before any processor markup. These rates are non-negotiable with card networks, but they can be influenced by how transactions are processed and what data is submitted alongside them.
That interchange variability makes your pricing model selection all the more consequential — because the model determines how those underlying costs hit your statement.
Pricing Model Structure
The pricing model shapes every dollar that flows through your processing account:
- Tiered pricing — Bundles transactions into "qualified," "mid-qualified," and "non-qualified" buckets. Processors decide which tier applies, and high-reward cards frequently land in the most expensive tier. Costs are obscured by design.
- Flat-rate pricing — Simple and predictable, but priced to cover the processor's worst-case scenarios. If your card mix skews toward lower-cost consumer debit, you're subsidizing a margin buffer you'll never benefit from.
- Interchange-plus pricing — Passes through actual interchange at cost, then adds a fixed, transparent processor markup. The only model that makes true cost comparison possible.
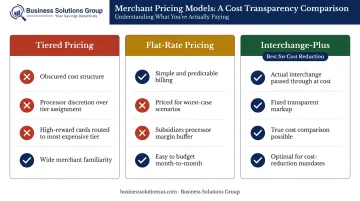
Switching from tiered or flat-rate to interchange-plus is often where merchants find the largest single reduction in effective rate — sometimes 0.3% to 0.5% on total volume.
Ancillary and Scheduled Fees
These fees don't appear in the per-transaction rate, but they accumulate steadily:
- Monthly account fees and statement fees
- Payment gateway fees (often charged separately from processing)
- Batch settlement fees
- PCI non-compliance penalties
- Chargeback fees (typically $20–$100+ per dispute)
- Minimum monthly processing fees
Unlike interchange, most of these are either negotiable or outright avoidable. They're rarely questioned because they appear as small, recurring line items—but they compound into a meaningful share of the total effective rate over a year.
Cost-Reduction Strategies for Merchant Fees
Strategies for reducing merchant fees fall into three categories depending on where cost originates.
Strategies That Change Decisions Before or at Setup
Switch to interchange-plus pricing. This is the most structurally impactful change available. Tiered and flat-rate pricing build opacity into the cost structure by design—interchange-plus removes it. Merchants with consistent volume can either request this model from their current processor or find one that offers it by default.
Compare providers using effective rate, not headline rate. Collect three months of statements and calculate your all-in effective rate (total fees ÷ total card volume). Use that number as the baseline when requesting quotes. Any processor quoting only a per-transaction percentage without disclosing gateway fees, monthly minimums, and other charges is structurally impossible to compare accurately.
Purchase equipment outright. Terminal leases lock merchants into long-term contracts with inflated recurring costs that have no relationship to processing performance. Purchasing terminals outright—or working with a processor that provides equipment at cost—eliminates this fixed expense from the effective rate entirely.
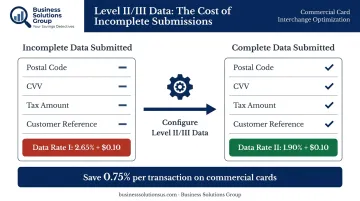
Configure transaction data correctly from the start. Many interchange downgrades happen because systems aren't set up to submit required fields: postal codes, CVV, and—for B2B transactions—Level II/III data such as tax amounts and customer reference numbers. According to Mastercard's data, activating Level II/III data can drop commercial card rates from 2.65% + $0.10 (Data Rate I) to 1.90% + $0.10 (Data Rate II).
Getting this right before transaction patterns become entrenched prevents a class of costs that are nearly impossible to recover retroactively.
Strategies That Change How Fees Are Managed
Track effective rate monthly. Most businesses review merchant statements only when something looks wrong. Calculating effective rate every month catches fee creep, unjustified downgrades, and billing errors before they compound. The formula is simple: (total fees ÷ total card volume) × 100. A trend that moves up by more than 0.1 points month-over-month warrants investigation.
Audit statements for red-flag fees. When reviewing statements, look specifically for:
- PCI non-compliance penalties (charged monthly when compliance requirements aren't completed)
- Statement fees and batch fees
- Monthly minimums being triggered by low-volume periods
- Assessment markups above the standard network rate
Processors frequently charge these without explanation — most disappear with a direct request.
Negotiate with data, not just intent. Processors respond to merchants who arrive with volume data, low chargeback rates, and a competitive quote from another provider. Rate reviews should be requested proactively every 12 months—not only at contract renewal or when switching. Business Solutions Group's benchmark analysis provides the external market comparisons needed to negotiate from a position of strength, identifying exactly where current rates diverge from what a merchant's volume and risk profile should command.
Maintain PCI compliance continuously. Non-compliance fees hit when annual requirements aren't completed or system configurations drift out of standard — both avoidable with a basic compliance calendar. Staying current eliminates this cost category and reduces fraud-related chargeback exposure at the same time.
Strategies That Change the Payment Environment
Route high-volume recurring payments to ACH. For subscription billing, B2B invoicing, and high-ticket recurring transactions, ACH transfers carry a fraction of card processing costs. Nacha reported 8.1 billion B2B ACH payments in 2025, up 9.9% from 2024—adoption at this scale reflects the economics. Offering ACH as a default or incentivized option for recurring B2B payments lowers the overall blended effective rate without affecting card-based retail transactions.
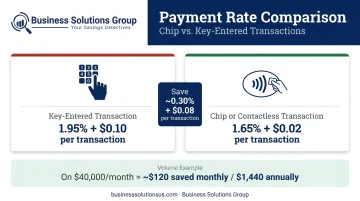
Enable contactless and chip entry at every terminal. Mastercard's official rate schedule shows that key-entered consumer Core transactions run at 1.95% + $0.10, while the equivalent chip-present transaction is 1.65% + $0.02. That 30-basis-point difference—plus the per-transaction fee gap—adds up across volume. Ensuring terminals support chip-first and tap-first entry eliminates interchange downgrades that stem from manual entry even when a card is physically present.
Reduce card acceptance costs with surcharging or cash discounting. Where state law permits, passing a portion of processing costs to cardholders through a compliant surcharge program shifts a meaningful share of effective rate off the merchant's books. Cash discount programs achieve a similar result by pricing products at the card rate and displaying a discount for cash or ACH — a distinction that affects how the program must be disclosed at point of sale.
Manage chargebacks before they escalate. A high chargeback ratio increases costs two ways: directly through per-chargeback fees and lost transaction revenue, and indirectly by signaling elevated risk to your processor. Visa's 2025 VAMP framework sets U.S. merchant thresholds at 220 basis points for Excessive status (dropping to 150 bps on April 1, 2026), and breaching these thresholds triggers rate reviews and program fees.
Clear billing descriptors, fraud screening tools, and a defined dispute response process address this before it compounds into a structural pricing problem.
Conclusion
Merchant fee reduction starts with knowing where costs actually come from. Merchants who benchmark their effective rate against peers and audit statements regularly are systematically better positioned than those who react only when margins become painful.
Fees shift continuously as card network rules update, business volumes change, and processors adjust pricing. That makes benchmarking an ongoing operational discipline, not a one-time exercise. Businesses with access to external benchmark data and advisory support compound savings over time rather than recovering them only in occasional negotiations.
Three actions anchor a sustainable cost-reduction process:
- Calculate your real effective rate and compare it against what your volume and transaction mix should cost
- Audit processor statements quarterly for surcharges, downgrades, and fee category changes
- Renegotiate when volume thresholds or market conditions shift in your favor
The first step takes under 30 minutes. Every negotiation and audit decision that follows builds on it.
Frequently Asked Questions
What is a typical merchant processing fee?
Most U.S. merchants pay between 2% and 3.5% per transaction when blending in-person and card-not-present volume. The more important figure is the effective rate—total fees divided by total card volume—which accounts for fixed monthly charges and is almost always higher than any per-transaction quote suggests.
How much would you expect to pay in credit card fees if sales are $100,000?
At an effective rate of 2.0%, that's $2,000 in fees. At 3.2%, it's $3,200. Where a specific business lands depends on its card mix, transaction method, and pricing model—three variables that each move the effective rate in different directions.
What is the difference between interchange fees and processor markup?
Interchange is the non-negotiable fee set by card networks and paid to the card-issuing bank. Processor markup is the negotiable portion added on top by your payment provider. Separating these two is exactly why interchange-plus pricing creates transparency: you can see what the network charges and what your processor charges as distinct line items.
What is an effective rate and how do I calculate it?
Effective rate = total processing fees ÷ total card sales volume × 100. If you paid $2,800 in fees on $100,000 in card volume, your effective rate is 2.8%.
What pricing model is best for reducing merchant fees?
Interchange-plus is the most transparent and typically lowest-cost option for established merchants: the processor markup is fixed and visible. Flat-rate pricing is simple but expensive at scale; tiered pricing is the least favorable because it obscures costs and gives processors discretion over transaction bucketing. For businesses with consistent monthly volume, interchange-plus is the right starting point.
Are there hidden fees on merchant processing statements I should watch for?
The most common categories: PCI non-compliance penalties, statement fees, batch fees, monthly minimums, and inflated assessment markups. These appear as small, recurring line items that rarely trigger concern on their own. Reviewing statements line by line, rather than just checking the per-transaction rate, typically uncovers charges that are negotiable or removable entirely.