Introduction
Carrier invoices are designed to be complex. Dozens of surcharges, fuel fees, dimensional weight charges, and accessorial costs accumulate across thousands of shipments — and most businesses pay them without question because manual review is impossible at scale.
The numbers tell the story: surcharges now account for 30–40% of total parcel spend, yet only about 25% of shippers systematically audit their invoices. The rest absorb billing errors, miss refund windows, and walk into carrier negotiations without knowing what comparable companies actually pay.
Parcel business intelligence changes this. By converting raw shipping data into clear cost breakdowns and benchmarks, BI tools help shippers identify overcharges, recover money they're owed, and enter carrier negotiations knowing exactly what comparable shippers pay.
Key Takeaways
- Parcel BI reveals hidden costs buried in carrier invoices — surcharges, billing errors, and unapplied discounts — that manual review misses
- Automated invoice auditing recovers money from service failures and billing errors — no extra work required from your team
- Rate benchmarking closes the information gap with your carrier, giving you real leverage in contract negotiations
- Track cost per shipment, on-time delivery rate, and discount utilization to measure savings and sustain them long-term
- Successful parcel BI starts with a clear goal, centralized data, and the right mix of technology and advisory support
What Is Parcel Business Intelligence?
Parcel business intelligence is the practice of collecting, centralizing, and analyzing shipping data to drive decisions toward a measurable outcome. The key phrase there is measurable outcome — BI isn't running reports. It's knowing which data points matter and using them to build a trajectory toward lower costs and better carrier performance.
BI vs. Basic Reporting
Most shippers already generate shipping reports. Parcel BI is fundamentally different:
- Basic reporting shows what happened — a snapshot, static and backward-looking
- True parcel BI identifies patterns in historical data, projects future impact, and recommends action
A report tells you that fuel surcharges cost $180,000 last quarter. Parcel BI tells you that 23% of those charges applied to shipments where a packaging adjustment would have reduced DIM weight — and models what that change saves annually.
The Four Core Components
A functional parcel BI system has four layers:
- Data collection: carrier invoices, tracking feeds, and surcharge records pulled automatically from UPS, FedEx, DHL, regional carriers, and couriers
- Data warehousing and scrubbing: centralizing and cleaning data so analysis is accurate, not distorted by duplicates or formatting inconsistencies
- Analytics: surfacing patterns in spend, performance, and billing accuracy across carriers and lanes
- Action: translating insights into cost recoveries, contract adjustments, or packaging changes that produce measurable results
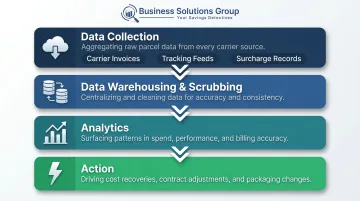
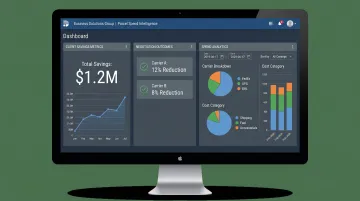
Business Solutions Group's Parcel Spend Intelligence platform manages over $3 billion in parcel spend and is built around this framework. Invoice data consolidates into dashboards where users can drill down to shipment-level detail and track cost category changes over time.
Parcel BI vs. Freight Intelligence
These two disciplines are related but distinct:
| Dimension | Parcel BI | Freight Intelligence |
|---|---|---|
| Focus | Your own shipping data: invoices, surcharges, performance | Market-wide rates, capacity, and carrier trends |
| Primary use | Invoice auditing, cost recovery, contract prep | Rate benchmarking, mode selection, market timing |
| Data source | Carrier invoices and tracking feeds | Aggregate market data across shippers |
Both are valuable. Used together, they give shippers internal spend visibility alongside external market context, which strengthens carrier negotiations on both sides of the table.
The Hidden Cost Problem: Why Parcel Shippers Need BI
Carrier invoices are intentionally complex. Residential surcharges, dimensional weight fees, fuel adjustments, and peak-period assessments each look manageable in isolation. Across thousands of shipments, they compound into serious overspending.
Surcharges alone now represent 30–40% of total parcel spend — with fuel surcharges accounting for 25–30% of that. For 2026, FedEx charges $6.45 per package for residential delivery; UPS charges $6.50. Multiply those by monthly shipment volume and the math gets uncomfortable fast.
Why Manual Review Fails
Auditing carrier invoices by hand is practically impossible at scale. The volume is too high, the line items too numerous, and the error types too varied. Automated audit platforms identify 50+ distinct error types across FedEx, UPS, and DHL invoices. No manual process catches all of them.
The result: up to 5% of parcel invoices contain billing errors, according to TransImpact — yet approximately 98% of late-delivery refunds that qualify go unclaimed. Industry estimates put unclaimed late-delivery refunds at $2 billion annually.
The Carrier Negotiation Disadvantage
Carriers negotiate contracts every day. They know their margins, their pricing levers, and their customers' shipping profiles better than most shippers know their own. Without BI, businesses enter negotiations at a structural disadvantage:
- No visibility into their own spend patterns
- No benchmark data to challenge carrier proposals
- No way to model the real impact of proposed rate changes
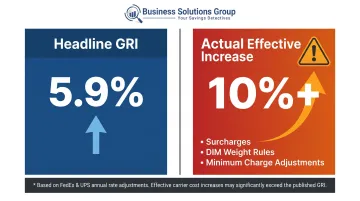
FedEx and UPS have announced a 5.9% average General Rate Increase for the third consecutive year. But as PARCEL Industry reports, actual effective increases often exceed 10% once you account for surcharges, DIM weight rules, and minimum charge adjustments. Shippers who plan using the headline GRI number systematically underestimate their exposure.
Chronic overpaying erodes product margins, limits competitive pricing, and surrenders leverage in every future carrier negotiation.
What Data-Driven Delivery Insights Look Like in Practice
Spend Visibility Across Every Carrier and Lane
Parcel BI platforms translate complex invoice data into dashboards that break spending down by carrier, service level, shipping zone, weight band, and surcharge type. Decision-makers can see where money is going without needing a data science background.
Lane-level analysis adds a layer of strategic value. It surfaces:
- Which shipping zones are disproportionately expensive relative to volume
- Whether premium service levels are being used on shipments that don't require them
- Where packaging choices are triggering dimensional weight overcharges that could be avoided
Business Solutions Group's platform is designed around this drill-down capability — allowing users to identify cost category changes over time and flag shipments that are driving unnecessary spend.
Carrier Performance and Billing Accuracy Data
Cost data alone doesn't tell the full story. BI platforms track carrier performance alongside spend:
- On-time delivery rates by carrier and lane (during Cyber Week 2025, UPS hit 98.9%, FedEx 98.3%, USPS 97.2% — useful benchmarks for holding carriers accountable)
- Billing error frequency — how often a carrier's invoices contain discrepancies
- Refund recovery rate — the percentage of eligible claims that are actually filed and collected
Tracking these metrics together makes it possible to hold carriers accountable to contract terms, not just published performance statistics.
Rate Benchmarking and Predictive Analytics
Carrier accountability only goes so far without knowing whether your contract rates are competitive to begin with. That's where benchmarking comes in.
Market rate data allows shippers to compare their rates against what similar companies pay — by service level, zone, and weight band. This context is essential before any carrier negotiation. Without benchmark data, there's no way to know whether a "favorable" contract actually reflects market rates or just carrier-favorable terms.
Advanced parcel BI platforms add another layer: predictive modeling. Using historical data and rate trend analysis, they forecast how upcoming GRIs, new surcharges, or policy changes will affect a specific shipper's cost structure. Shippers who have this visibility can adjust budgets and renegotiate terms before rate changes hit — rather than absorbing costs after the fact.
How Parcel BI Reduces Shipping Costs
Automated Invoice Auditing and Recovery
Parcel BI platforms scan every invoice against contract terms continuously — catching billing errors, unapplied discounts, and service failures that qualify for refunds. Claims are filed within carrier windows (both UPS and FedEx require claims within 15 days of the scheduled delivery date).
Automated auditing typically recovers 2–5% of total shipping spend. For a business spending $2 million annually on parcel, that's $40,000–$100,000 per year that would otherwise go unclaimed. Business Solutions Group's audit and recovery service is designed to generate returns within the first billing cycle — with clients receiving 100% of recovered credits.
Data-Driven Contract Negotiations
Spend analytics and market benchmarks change what's possible at the negotiating table. Data-driven negotiations yield 10–30% cost reductions according to industry sources, while expert-led approaches with proprietary benchmark data consistently achieve 15–40% savings.
Business Solutions Group's proprietary spend intelligence software — supported by former UPS and FedEx senior pricing analysts — benchmarks a client's full shipping profile against market-appropriate rates, identifies achievable discounts based on shipment characteristics, and builds the financial case carriers respond to.
Clients see an average of 23.6% savings through this process, with the full cycle from benchmarking to implementation typically completing in 6–8 weeks.
The company operates on a performance-based model: no upfront cost, no fee if no savings are identified.
DIM Weight Charge Optimization
Both FedEx and UPS use a standard DIM divisor of 139 for domestic shipments. Any package billed at DIM weight — meaning the dimensional calculation exceeds actual weight — is costing more than necessary if the packaging is oversized.
Parcel BI identifies exactly which shipments trigger DIM fees and at what frequency, giving shippers the data to right-size packaging and negotiate contract terms that reflect their actual shipping profile. Since fuel surcharges are applied as a percentage of the base rate (which is itself calculated on billable DIM weight), every dollar removed from DIM-inflated base rates reduces the surcharge stack applied on top of it.
Building a Parcel BI Strategy Step by Step
Step 1: Define a Specific, Measurable Goal
BI without a defined objective produces reports, not results. Before collecting data, identify what you're trying to achieve:
- Reduce total shipping spend by X%
- Recover invoice billing errors worth $Y per month
- Improve on-time delivery rate on a specific lane
- Prepare for an upcoming carrier contract renegotiation
The goal determines which metrics to prioritize, which data sources to connect, and how to measure success. Dashboards are a tool, not an outcome — the objective should drive every decision about what to build and track.
Step 2: Centralize Your Data Sources
Map every point in your logistics operation where data is generated:
- Outbound shipment records
- Carrier invoices (all carriers, all modes)
- Tracking and delivery confirmation feeds
- Warehouse handoff records
- Inbound freight invoices
Data that lives in departmental silos or separate spreadsheets can't be analyzed at the level parcel BI requires. A central platform is non-negotiable.
Step 3: Pair the Right Technology with Expert Advisory Support
Raw data surfaces patterns, but acting on those patterns requires carrier market knowledge that most internal teams don't have. That's where combining an analytics platform with experienced advisory support makes a measurable difference.
Business Solutions Group pairs its Parcel Spend Intelligence software with supply chain advisors — including former carrier pricing analysts — who translate what the data shows into concrete negotiation strategies and contract outcomes. The model works for shippers across a wide range of volumes, from a few hundred packages per month to tens of thousands.
What to look for in a technology-plus-advisory setup:
- A platform that ingests data from all carriers and modes in one place
- Advisors with direct carrier pricing experience, not just logistics generalists
- Benchmark data that puts your rates in market context
- Clear accountability for savings outcomes, not just reporting
KPIs Every Parcel Shipper Should Track with Parcel BI
Core Cost Metrics
These baselines establish the foundation for tracking improvement:
- Average cost per shipment — the primary measure of overall shipping efficiency
- Cost per pound — normalizes cost across varying package weights
- Total spend by carrier and service level — reveals whether spend is concentrated in high-cost service tiers unnecessarily
Carrier Performance Metrics
Track these to pinpoint where service gaps are costing you money:
- On-time delivery rate by carrier and lane — pinpoints where service failures are occurring and refund claims may be due
- Billing error frequency — tracks how often a carrier's invoices require correction
- Refund recovery rate — measures what percentage of eligible claims are actually captured
Contract Health Metrics
Use these to confirm your carrier agreements are working as written:
- Discount utilization rate — confirms that contracted discounts appear on every applicable invoice
- Volume commitment adherence — tracks whether shipment volumes align with contract tier requirements
- Surcharge-to-base-rate ratio — flags accessorial charges creeping above base shipping costs
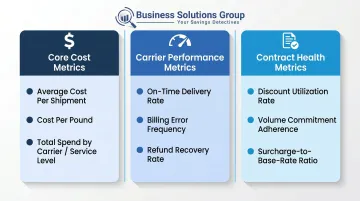
Contract health metrics should feed directly into your next renegotiation cycle. A surcharge-to-base-rate ratio that has climbed since the last contract was signed isn't just a cost problem — it's documented leverage for getting better terms.
Frequently Asked Questions
What does a parcel auditor do?
A parcel auditor reviews carrier invoices to identify billing errors, unapplied discounts, and service failures — like late deliveries — that entitle shippers to refunds. Claims are filed on the shipper's behalf within the carrier's 15-day window to recover those funds.
What is a parcel in the supply chain?
A parcel refers to a small package transported through carrier networks — such as UPS, FedEx, or USPS — from shipper to end recipient. Parcel shipments are a major cost category for businesses in e-commerce, retail, and distribution, distinct from freight shipments handled by LTL or truckload carriers.
What are the 5 stages of business intelligence?
The core stages are data collection, storage, analysis, insight generation, and decision-making. In a parcel context, this means pulling carrier invoice data, analyzing spend patterns, and acting through audits or contract negotiations.
What are the three major types of business intelligence?
Descriptive BI reports on what happened, predictive BI forecasts what will happen, and prescriptive BI recommends what to do. Gartner adds a fourth type — diagnostic BI — which identifies why something happened. Mature parcel programs use all four.
How can parcel business intelligence help reduce shipping costs?
Parcel BI targets costs on multiple fronts: it recovers carrier billing errors automatically, supplies the spend data needed to negotiate better contracts, flags DIM weight overcharges, and guides smarter carrier selection through performance benchmarks.
What KPIs should I track to measure parcel shipping performance?
Start with cost per shipment, cost per pound, on-time delivery rate by carrier, billing error recovery rate, and contract discount utilization rate. These five metrics cover both cost efficiency and whether your carrier is honoring negotiated terms.