That passivity is expensive. According to Supply Chain Management Review, FedEx and UPS parcel shipping costs increased 30% cumulatively over three years — roughly 10 percentage points above what compounded published GRIs would suggest. Most shippers absorbed every dollar of that gap.
This guide covers what parcel spend intelligence is, why carrier costs are harder to control than the headline numbers imply, which metrics actually matter, and the strategies that let businesses push back rather than just absorb.
Key Takeaways
- Published GRIs understate actual cost increases — surcharges drive the real gap
- Accessorial fees can represent 30–40% of a total parcel invoice (Pitney Bowes)
- Spend intelligence is continuous and forward-looking — auditing only looks backward
- Zone distribution, DIM weight, and service level mix are the highest-leverage cost levers
- Carrier contracts should be reviewed quarterly, not just at renewal
What Is Parcel Spend Intelligence?
Parcel spend intelligence is the practice of collecting, analyzing, and acting on granular shipping data — base rates, accessorial fees, zone distribution, weight profiles, surcharge exposure, and carrier performance — to make proactive decisions about parcel costs rather than reactive ones.
That distinction separates spend intelligence from basic invoice auditing.
Auditing finds billing errors after the fact. It answers: "Were we overbilled last week?"
Spend intelligence answers a different set of questions: Where are costs trending? Which surcharges are growing fastest? Are negotiated discounts still being applied? What would a carrier mix shift actually cost or save?
Why Parcel Shipping Is Uniquely Difficult to Manage
Other cost categories — procurement, labor, facilities — have relatively stable, structured data. Parcel shipping doesn't. Three factors make it uniquely hard to control:
- Shipment complexity: Every shipment is a separate event with its own destination, weight, dimensions, service level, and carrier-applied surcharges
- Contract opacity: Carrier contracts run to dozens of pages with fine-print accessorial schedules that shift annually
- No data standardization: Formats differ across carriers, making manual consolidation impractical at any meaningful volume
The traditional response was gain-share consulting: hire an outside firm, pay them a percentage of savings, get a contract renegotiation, and repeat the cycle when costs creep back up. The limitation is that shippers never build lasting visibility — the intelligence lives with the consultant, not the client.
Technology-driven spend intelligence platforms give shippers that visibility directly — continuously, not just at contract renewal time.
Business Solutions Group's proprietary spend intelligence software manages over $3 billion in parcel spend and surfaces more than 40 actionable insights through consolidated dashboards clients access themselves. The platform also includes a "What if" scenario modeling capability, so clients can test the cost impact of operational changes before committing to them.
Why Parcel Spend Is Harder to Control Than You Think
The GRI Reality Gap
Carriers announce General Rate Increases each January using a headline percentage. That number is consistently misleading.
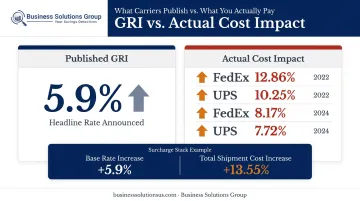
The 2022 published GRI was 5.9% for both FedEx and UPS. Reveel's analysis, reported by SCMR, found the actual impact was 12.86% for FedEx customers and 10.25% for UPS customers. For 2024, using the same 5.9% headline, Reveel found average customers paid 8.17% more with FedEx and 7.72% more with UPS.
BSG's own client analysis confirms the same pattern. In one documented case, a published 5.9% GRI translated to a 7.1% actual cost increase , driven by surcharges increasing at nearly 10% — far outpacing base rate adjustments.
The mechanism is straightforward: surcharges sit outside the GRI announcement. Cass Information Systems analyzed a 2025 example of a package under 50 lbs to Zone 5 where the transportation rate rose 5.9%, but total shipment cost rose 13.55% because the Additional Handling charge increased 25.9%.
Accessorial Fee Creep
According to Pitney Bowes, surcharges and accessorials now represent 30–40% of a total parcel invoice. They're not a footnote — they're a primary cost driver.
What makes this difficult to manage:
- New fees are introduced mid-contract without triggering renegotiation rights
- Existing surcharge categories get reclassified in ways that bypass negotiated discounts
- Negotiated surcharge discounts have expiration dates that rarely align with contract end dates
- Fee increases are announced in carrier rate guides that most shippers don't monitor closely
For 2025, UPS Ground Residential surcharges increased 8.0%, Additional Handling fees increased 26–27%, and Over Maximum Limits jumped 42% , all separate from the base GRI.
Businesses without automated contract compliance tracking often pay full surcharge rates for months before anyone notices a discount has lapsed.
The Budget Planning Problem
The surcharge volatility described above creates a direct problem for annual planning. When the real cost impact isn't visible at the line-item level, any budget projection built on the published GRI percentage is working from incomplete data.
The actual cost increase a business faces varies based on its specific shipping profile: zone mix, weight distribution, service level split, and surcharge exposure. A business shifting toward more residential deliveries, heavier packages, or longer-distance zones will see cost increases well above the GRI, regardless of what the carrier announced.
The Key Metrics a Parcel Spend Intelligence Tool Should Track
Total Spend as a Percentage of Revenue or Operational Costs
Tracking parcel spend in absolute dollars is insufficient. The meaningful number is its ratio to sales (for e-commerce operations) or to total operational costs (for manufacturers and distributors). This ratio signals when shipping is eroding margin even while overall volume grows — a pattern that absolute-dollar tracking masks entirely.
Surcharge Composition and Trend
A spend intelligence platform should break surcharge spend out by:
- Type — residential, fuel, delivery area, additional handling, address correction, DIM-related
- Carrier — since the same surcharge category can increase at very different rates across carriers
- Trend — quarter-over-quarter and year-over-year, not just point-in-time snapshots
Individual surcharges may look minor in isolation. Collectively, at 30–40% of invoice value, they're not.
Average Zone and Dimensional Weight Utilization
Average zone is one of the clearest indicators of structural cost. Packages traveling Zone 7 or 8 cost significantly more than Zone 2 or 3 shipments. Monitoring zone distribution over time reveals whether fulfillment decisions, supplier locations, or carrier routing are creating unnecessary distance — and whether adjustments are having the intended effect.
Zone distribution tells you where packages are going; DIM weight determines what you're billed when they get there. When a package's dimensional weight exceeds its actual weight, the carrier bills on volume. Small packaging changes — reducing box dimensions by even an inch — can shift entire shipment categories to lower weight tiers.
Carrier Performance Alongside Cost Data
A carrier that appears cheaper on paper may generate higher total costs through:
- Late delivery claims that require refund processing
- Exception handling and re-delivery charges
- Damage claims and replacement costs
A spend intelligence tool should surface on-time delivery rates, exception frequency, and claim rates by carrier, lane, and service type — not just invoice totals. BSG's platform tracks carrier-specific delivery delays and incorrect deliveries as part of its performance monitoring, making the cost-of-service calculation visible alongside the rate-per-shipment figure.
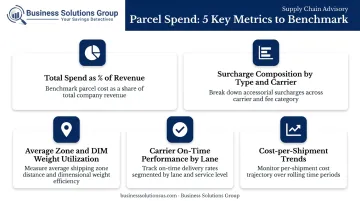
Service Level Utilization and Cost-per-Shipment Trends
Many shippers default to express air services when ground delivery would meet the customer's actual expectation. Mapping service level usage against real delivery performance — did the 2-day air shipment actually arrive in 2 days versus what ground would have delivered? — often surfaces real downgrade opportunities.
Cost-per-shipment trending over time separates three distinct drivers of rising costs:
- Carrier pricing changes — rate increases applied at the contract or tariff level
- Shipping profile shifts — heavier packages, longer zones, or mix changes
- Internal operational changes — order patterns, packaging decisions, fulfillment locations
Knowing which driver is responsible determines where the fix actually lives.
Proven Strategies to Reduce Parcel Spend
Negotiate Proactively — Not Just at Renewal
Carriers expect negotiation. Most shippers only engage at contract expiration, which hands carriers control of the timing and terms. Businesses with spend intelligence data can negotiate from documented facts: lane performance, volume trends, surcharge exposure, and competitive benchmarks.
Business Solutions Group's advisory service runs a full analysis of shipment data against proprietary market-rate intelligence — establishing baselines and projecting market-appropriate rates for each service and surcharge category. BSG has coached clients through negotiations collectively saving more than $1 billion, with typical savings between 15–40%.
Contract terms warrant review at minimum quarterly. Changes in shipping volume, profile, or surcharge exposure justify amendments even within active contracts.
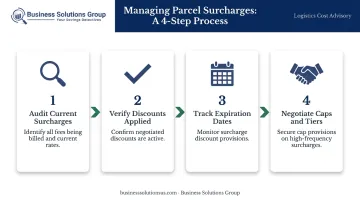
Treat Surcharges as a Dedicated Cost Category
Surcharges deserve the same management discipline as base rates:
- Audit which surcharges are currently being billed and at what rates
- Verify negotiated discounts are still being applied correctly
- Track expiration dates on surcharge discount provisions
- Negotiate cap provisions or tiered discounts on high-frequency surcharges (residential, additional handling, delivery area)
BSG's platform performs weekly post-audits of prior shipments to verify rate application, with clients receiving 100% of any recovered credits.
Optimize Zone Distribution Through Fulfillment Strategy
Zone skipping — reducing the average zones packages travel by redistributing inventory or selecting different origin facilities — is a structural cost lever that doesn't require carrier negotiation. The savings come directly from geography.
A spend intelligence tool that shows cost per zone, volume by zone, and cost-per-package by origin point can identify where modest fulfillment changes produce significant savings. This analysis is also a prerequisite for any serious multi-carrier strategy, since carrier economics vary significantly by zone.
Build a Multi-Carrier Strategy — But Model It First
Once zone data is in hand, routing shipments to the carrier best suited for each lane, service level, or weight tier generates real savings. The risk: minimum annual revenue commitments (MARCs) in existing carrier contracts. Reallocating volume without modeling the impact can trigger penalties that erase the savings.
A documented example from Sifted shows an e-commerce retailer spending $35M annually with UPS shifted approximately 630,000 of its lightest monthly packages to an alternative carrier and saved more than $235,000. The key was identifying the right package profile before moving volume.
Recover Carrier Service Failure Refunds Systematically
When shipments are delivered late, carriers owe refunds under their service guarantees. UPS requires claims to be submitted within 15 days of the scheduled delivery date — a window that's easy to miss without automated tracking.
Shipware estimates that late deliveries qualifying for refunds occur on 2–5% of packages, and that over $2 billion in eligible refunds go unclaimed annually by businesses using UPS and FedEx. BSG's platform identifies service failures and collects applicable credits automatically, with clients receiving 100% of recovered amounts.
What to Look for in a Parcel Spend Intelligence Tool
Not all parcel analytics platforms deliver the same capabilities. The right tool does more than generate reports — it surfaces billing errors, models future scenarios, and keeps cost management proactive rather than retroactive.
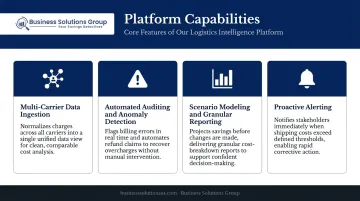
Look for these four capabilities when evaluating a platform:
- Multi-carrier data ingestion: Pulls invoice and shipment data from all carriers — FedEx, UPS, DHL, regional carriers — and normalizes charges so cost comparisons hold regardless of how individual carriers structure their invoices. Insights should be carrier-agnostic, not filtered through a carrier's preferred reporting lens.
- Automated auditing and anomaly detection: Matches invoiced charges against contracted rates, flags billing errors, and identifies surcharge anomalies — then automates refund claim submission so recovery happens without manual intervention.
- Scenario modeling and granular reporting: Models cost impacts before changes are implemented, projecting savings and delivery outcomes across different carrier mixes, service levels, or routing decisions. Reporting should segment by carrier, zone, lane, service type, and business unit.
- Proactive alerting: Notifies users when shipping costs begin exceeding expected thresholds, shifting operations from reactive reporting to real-time management.
Business Solutions Group's spend intelligence platform covers all four: weekly post-audits, anomaly detection, credit recovery, and "What if" scenario modeling — applied against historical data to project both cost savings and delivery time outcomes.
Common Parcel Spend Management Mistakes
Three patterns consistently erode parcel budgets — and most businesses don't catch them until the damage is done.
Treating shipping as a fixed cost. Accepting annual rate increases as unavoidable is the most common and costly mistake. Parcel shipping is a managed expense, not an overhead line item. Companies that recover the most apply the same scrutiny to shipping as they do to procurement or labor.
Relying on gain-share consulting without building internal intelligence. Gain-share engagements generate savings during the engagement period, but costs typically drift back once it ends. The limitation is structural: visibility lives with the consultant, not the client. When advisory support is paired with a proprietary spend intelligence platform — as Business Solutions Group structures its engagements — clients own their data and retain optimization capability between formal reviews.
Ignoring surcharge discount expiration dates. Negotiated surcharge discounts often expire before the contract does. Without automated contract compliance monitoring, businesses routinely pay full surcharge rates for months without noticing. BSG's platform monitors whether carriers have applied all cost-related contract terms correctly, flagging cases where rebate credits, rates, or negotiated discounts have been incorrectly applied.
Frequently Asked Questions
What is parcel spend intelligence?
Parcel spend intelligence is the practice of collecting and analyzing granular shipping data — rates, surcharges, zones, carrier performance — to make continuous, proactive decisions about parcel costs. Unlike basic auditing, it provides forward-looking visibility into cost drivers and optimization opportunities, not just a review of past invoices.
How does a parcel spend intelligence tool reduce shipping costs?
The tool surfaces billing errors, tracks surcharge exposure against contracted terms, identifies over-serviced shipments where a lower service level would suffice, and provides the documented data needed to negotiate better carrier terms.
What key metrics should businesses track for parcel spend management?
The most impactful indicators to track include:
- Total spend as a percentage of revenue
- Surcharge composition by type and carrier
- Average zone distribution and DIM weight utilization
- Carrier on-time performance by lane
- Cost-per-shipment trends over time
How often should businesses review and renegotiate carrier contracts?
At minimum quarterly, not just at contract renewal. Carriers expect ongoing negotiation, and material changes in shipping volume, profile, or surcharge exposure justify contract addendums even during active terms. Waiting for annual renewal leaves money on the table.
What is the difference between a parcel audit and parcel spend intelligence?
A parcel audit identifies billing errors and recovers refunds from past invoices: it's retrospective by design. Spend intelligence provides continuous visibility into cost drivers, contract compliance, carrier performance, and optimization opportunities going forward.
How can businesses prepare for annual General Rate Increases?
Model GRI impact against your actual shipping profile, not the carrier's headline percentage. Surcharge increases are excluded from GRI figures entirely, so historical data broken down by zone, service level, and weight will typically show cost increases well above the published average.