
That gap between what is spent and what delivers actual health benefit is exactly the problem cost-effectiveness analysis (CEA) was built to address. CEA provides a structured, evidence-based framework for comparing the costs and health outcomes of competing interventions — so decision-makers can direct scarce dollars toward interventions that genuinely move the needle.
This article explains what CEA is, why it matters for healthcare spending decisions, how to run one step by step, and what a real-world application looks like in practice.
Key Takeaways
- CEA compares intervention costs against health outcomes, producing a cost-per-outcome ratio that enables direct comparison across diseases and programs.
- The Incremental Cost-Effectiveness Ratio (ICER) is the core metric — it quantifies how much extra cost is required to gain one additional unit of health benefit.
- US payers reference a benchmark of $100,000–$150,000 per QALY, though this is not a statutory coverage threshold.
- CEA informs formulary decisions, vaccine policy, screening design, and public health investment — but must be paired with equity and ethical review.
- Perspective (societal, payer, or health system) must be locked in before analysis starts — switching it mid-study invalidates cost comparisons.
What Is Cost-Effectiveness Analysis in Healthcare?
Cost-effectiveness analysis is an economic evaluation method that compares the relative costs and health outcomes of two or more interventions to determine which delivers the greatest health benefit per dollar spent. For healthcare decision-makers — from federal agencies to private payers — it provides a consistent framework for asking: is this worth it?
Where CEA Gets Used
CEA shapes decisions across every major layer of healthcare:
- Payers use it to determine whether a new drug or device justifies its price relative to existing options
- National formulary bodies — like NICE in the UK — rely on it formally; US payers apply it informally through ICER assessments
- The CDC's Advisory Committee on Immunization Practices (ACIP) regularly weighs cost-effectiveness evidence when evaluating vaccine recommendations
- Clinical guideline developers use it to identify which screening intervals, treatment sequences, or preventive protocols offer the best value
A survey of 50 US payer advisors found that 74% considered ICER findings at least somewhat impactful on coverage and formulary decisions, with 52% using them in pricing negotiations.
That reach into pricing and coverage decisions is part of why CEA is often confused with a related but distinct tool: cost-benefit analysis.
CEA vs. Cost-Benefit Analysis
| Method | Outcome Unit | Output | Best Used When |
|---|---|---|---|
| CEA | Health units (QALYs, lives saved, cases prevented) | Cost-per-outcome ratio | Comparing health interventions |
| CBA | Monetary value | Net benefit (benefits minus costs) | Comparing health and non-health programs |
CEA is the preferred framework in healthcare precisely because assigning a dollar value to a life year or a disability-free year raises ethical concerns that most health systems prefer to avoid.
Why CEA Is Critical for Healthcare Spending Decisions
Without a systematic method to evaluate value, organizations default to spending based on cost alone, vendor relationships, or political pressure. The result: low-value interventions get funded while high-impact programs go underfunded.
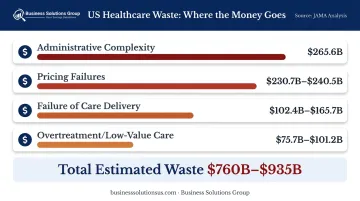
A JAMA waste analysis estimated $760B–$935B in annual US healthcare waste. Here's where that spending actually lands:
- Administrative complexity: $265.6 billion
- Pricing failures: $230.7B–$240.5 billion
- Failure of care delivery: $102.4B–$165.7 billion
- Overtreatment or low-value care: $75.7B–$101.2 billion
CEA directly addresses the last two categories by giving decision-makers a rigorous framework to identify which interventions deliver real clinical value and which do not. In practice, that framework delivers several concrete advantages:
What CEA Delivers to Decision-Makers
- Enables apples-to-apples comparison of interventions across different diseases and populations
- Identifies high-value interventions that produce outsized health gains per dollar
- Flags dominated interventions where equivalent outcomes are achievable at lower cost
- Supports evidence-based pricing and coverage negotiations with pharmaceutical and device manufacturers
- Gives budget allocation decisions a documented, transparent rationale that can withstand scrutiny
The Equity Caveat
Relying solely on ICER scores carries risk. The National Council on Disability has noted that QALY-based valuation can systematically devalue treatments for people with disabilities, since their baseline health state may generate fewer measurable QALYs even when an intervention delivers genuine benefit.
Current best-practice CEA frameworks incorporate distributional analysis and equity review alongside cost-effectiveness data — not as an afterthought, but as a core input.
How Cost-Effectiveness Analysis Works — Step by Step
One overarching rule applies to every step: define your perspective before you begin. Whether you're taking a health system view, a payer view, or a societal view will determine which costs count and which do not. Changing perspective mid-analysis invalidates your cost comparisons entirely.
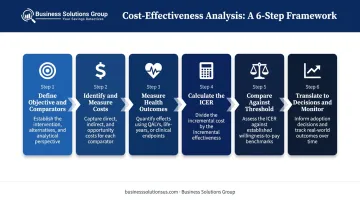
Step 1 — Define the Objective and Comparators
Specify:
- The exact intervention being evaluated
- The comparator (typically current standard of care or status quo)
- The target population
- The time horizon
Ambiguous objectives consistently produce unusable CEA results. If your team cannot agree on what counts as a valid comparator, that disagreement will surface in every downstream calculation.
Step 2 — Identify and Measure All Relevant Costs
Capture direct costs — clinical staff time, diagnostics, treatment delivery, administration — and, depending on your perspective, indirect costs such as patient travel time, productivity losses, and caregiver burden.
The most common error at this stage: capturing only direct clinical costs and ignoring downstream averted costs. An intervention that prevents hospitalizations generates substantial offsetting savings; leaving those out dramatically understates its economic case.
Step 3 — Measure Health Outcomes in a Consistent Unit
Quality-Adjusted Life Years (QALYs) are the most widely used outcome unit because they capture both quantity of life (years gained) and quality of life (utility-weighted health states). Alternatives include life-years gained, cases prevented, or DALYs.
The critical rule: every intervention in the analysis must use the same outcome unit. Comparing one program measured in QALYs against another measured in cases prevented makes ranking impossible.
Step 4 — Calculate the ICER
The formula:
ICER = (Cost of new intervention − Cost of comparator) ÷ (Health outcomes of new intervention − Health outcomes of comparator)
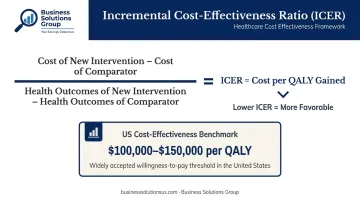
This yields a cost per unit of health gained. A lower ICER is more favorable.
The common error here is comparing average costs rather than incremental (marginal) costs. CEA is fundamentally about what you gain by switching — not about absolute cost levels.
Step 5 — Compare Against a Threshold and Interpret
In the US, ICER uses $100,000–$150,000 per QALY as its health-benefit price benchmark range. Interventions below this threshold are generally considered cost-effective; those above require additional justification.
Important caveats:
- This is ICER's benchmark range, not a statutory coverage rule
- Federal law restricts HHS and PCORI from using QALY-based thresholds in Medicare coverage or reimbursement decisions
- Germany's IQWiG uses an efficiency frontier approach instead — comparing therapies within a disease area rather than applying a cross-disease threshold
Never make a coverage or funding decision on ICER alone. Budget impact, equity implications, evidence certainty, and clinical context all factor in.
Step 6 — Translate Results Into Decisions and Monitor
CEA findings should drive concrete outputs. Document the decision rationale at each step for transparency and accountability:
- Formulary listing recommendations
- Reimbursement pricing adjustments
- Program scale-up or phase-out decisions
- Budget reallocation proposals
Build in a review cycle. As real-world evidence accumulates, intervention costs shift, and population needs evolve, the analysis should be revisited — not treated as final.
Cost-Effectiveness Analysis in Practice — A Healthcare Walkthrough
This walkthrough applies the six-step process to a simplified but realistic scenario: a health system evaluating whether to fund an expanded diabetes screening program for adults aged 40–60 versus continuing current opportunistic testing.
Steps 1–2: Define Objectives and Costs
The health system defines:
- Perspective: Health system
- Time horizon: 10 years
- Comparator: Current opportunistic testing at point of care
Cost data collected includes program implementation costs, staff time, screening test costs, and — critically — the averted downstream treatment costs for undetected diabetes complications (kidney disease, cardiovascular events, amputations). This last category is the one teams most consistently undercount, and it's typically where prevention programs make their strongest economic case.
For reference, published CEA evidence on diabetes screening shows ICERs well within conventional cost-effectiveness ranges. A JAMA analysis of opportunistic screening found an ICER of $56,649 per QALY gained; a population-based screening model reported $31,147 per QALY gained — both published in earlier decades and based on modeling assumptions, making them directional rather than definitive.

Steps 3–4: Measure Outcomes and Calculate the ICER
Outcomes are measured in QALYs gained from earlier case detection and complication prevention. The ICER is calculated by dividing the incremental cost difference between the expanded program and current practice by the incremental QALY difference.
Two places where teams commonly go wrong:
- Failing to extrapolate outcomes over the full 10-year horizon (undervaluing prevention)
- Not accounting for cases that would have been detected anyway under current practice (overstating the incremental benefit)
Step 5: Interpret Against the Threshold
Scenario A — ICER below $100,000 per QALY: The program is cost-effective under standard US benchmarks. The recommendation supports funding.
Scenario B — ICER between $100,000–$150,000 per QALY: The decision becomes nuanced. Three additional factors come into play:
- Budget impact: What does full-scale implementation actually cost the system?
- Equity considerations: Does the program reach underserved populations disproportionately affected by undiagnosed diabetes?
- Evidence certainty: How robust are the underlying QALY estimates?
Using the Results
In a Scenario B outcome, the unresolved equity and evidence questions make a phased approach more defensible than immediate full-scale rollout. The health system uses the CEA findings to recommend a 3-year pilot with a defined re-evaluation point — a decision structure that preserves the option to expand, modify, or discontinue based on real-world data. Well-executed CEA produces exactly this kind of revisable commitment, not a permanent mandate.
How Business Solutions Group Can Help
The logic of cost-effectiveness analysis — comparing what you spend against what you actually get — applies well beyond clinical decisions. Healthcare organizations carry significant operational and procurement spending that often goes unexamined with the same rigor applied to clinical programs.
Business Solutions Group works with healthcare organizations to apply that same value-focused discipline to supply chain, procurement, and vendor spending. Their services span four core areas:
- Benchmarks your spending against proprietary market-rate databases to surface where costs are out of line
- Streamlines purchasing workflows through eProcurement tools to reduce administrative friction and capture missed savings
- Renegotiates vendor and carrier contracts where pricing no longer reflects current market conditions
- Identifies end-to-end savings opportunities including misapplied discounts, unused services, and unclaimed rebates

Across these service lines, BSG typically surfaces savings of 15–40% on analyzed spend categories. Their starting point is a free, no-obligation savings analysis — a diagnostic that confirms whether meaningful savings exist before any formal engagement begins.
To get started, contact Business Solutions Group at (949) 525-7677 or visit businesssolutionsus.com to request your free savings analysis.
Frequently Asked Questions
What is the purpose of cost-effectiveness analysis?
CEA helps decision-makers compare interventions by their cost per unit of health gained, so limited budgets can be directed toward the interventions that deliver the most health benefit. It provides an evidence-based foundation for coverage, formulary, and program funding decisions.
What are the 5 steps of cost-benefit analysis?
A standard CBA defines the objective, identifies all costs and benefits, monetizes those benefits in dollar terms, and calculates a net benefit or benefit-cost ratio. The key difference from CEA is that CBA converts all outcomes into monetary values, while CEA keeps outcomes in health units.
How can cost-effectiveness analysis help keep government spending down?
CEA allows government health agencies to rank interventions by value, avoid funding low-value treatments, and negotiate evidence-based prices with manufacturers. This reduces waste without necessarily cutting coverage or access.
What is the difference between cost-effectiveness analysis and cost-benefit analysis?
CEA measures outcomes in health units (QALYs, lives saved) and produces a cost-per-outcome ratio. CBA converts all outcomes into monetary values to produce a net benefit figure. CEA is generally preferred in healthcare when assigning a dollar value to health outcomes raises ethical concerns.
What is an ICER in healthcare cost-effectiveness analysis?
ICER, or Incremental Cost-Effectiveness Ratio, measures the additional cost required to gain one extra unit of health benefit (typically one QALY) compared to an alternative. It is the primary metric for assessing whether a new treatment is cost-effective against a defined willingness-to-pay threshold.
What are the main limitations of cost-effectiveness analysis in healthcare?
CEA can disadvantage patients with disabilities or chronic conditions who yield fewer QALYs from treatment. It also relies on modeling assumptions and incomplete evidence. These limitations mean CEA should inform — not solely determine — healthcare coverage and spending decisions.