Introduction
Family health plan premiums now average $26,993 per year, up 53% over the past decade, according to KFF's 2025 Employer Health Benefits Survey. For most employers, that trajectory feels inevitable — a cost of doing business that gets absorbed at renewal and passed along to employees.
It isn't inevitable. A 2019 JAMA study estimated that roughly 25% of total U.S. healthcare spending is waste — meaning a substantial portion of what employers pay is addressable, not fixed.
Most employers make plan decisions without the data needed to understand what's actually driving spend. Fully insured models withhold claims-level detail. Carrier reports summarize rather than diagnose. Renewals arrive with rate increases and no explanation of why.
Data analytics changes that. When employers have access to claims-level data, they can see exactly where spend is concentrating — which conditions, which providers, which utilization patterns — and act on it. This article covers how analytics applies at each stage of the plan year, from diagnosing cost drivers to selecting strategies that reduce spend without reducing benefits.
Key Takeaways
- Health plan costs rise fastest when employers can't see what's driving them , and most employers lack that visibility
- The top 5% of commercially insured members account for 53% of total spending, making targeted analytics more valuable than broad cost-shifting
- Pharmacy trend is accelerating: specialty drugs are projected at 13.3% trend for 2025
- Effective cost control combines plan design decisions, in-year utilization management, and ongoing vendor accountability
- Independent analytics (not carrier-provided summaries) consistently surface the cost drivers that matter most
How Health Plan Costs Typically Build Up
Health plan costs rarely spike from a single event. They compound — gradually, year over year — through a combination of rising utilization, deferred preventive care, growing high-cost claimant populations, and pharmacy trends that go unmonitored.
The accumulation is especially hard to detect in fully insured arrangements. Carriers provide summary-level reporting: total claims paid, aggregate utilization rates, maybe a condition-category breakdown. What employers don't receive is the claims-level data that would reveal which members are driving cost, which care settings are overused, or where pharmacy spend is accelerating.
By the time the problem surfaces, it's typically at renewal — when the rate increase is locked and there's no opportunity to intervene in the current plan year.
Where the Cost Concentration Actually Lives
The distribution of health plan spend is far more concentrated than most employers realize:
- The top 5% of commercially insured members account for 53% of total spending
- The bottom 50% account for less than 5% of spending
- 61% of the top spenders in any given year are new to that cohort — meaning early identification matters
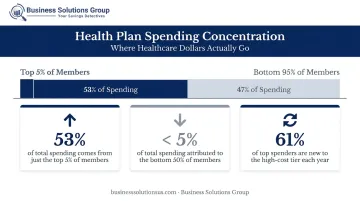
This pattern has a direct implication: managing "average" utilization does almost nothing to control total cost. The opportunity lies in identifying the members in, or moving toward, that top-cost tier — which requires claims-level data, not summary reports.
Business Solutions Group applies the same analytical lens to health plan cost as it does to any major spend category — identifying where concentration exists, then targeting those areas with data-driven interventions rather than broad plan design changes.
Key Cost Drivers for Health Plans
Claims Concentration and Chronic Conditions
High-cost claims cluster around a predictable set of conditions: cancer, cardiovascular disease, diabetes, and musculoskeletal issues consistently drive a disproportionate share of plan spend. Prescription drug spending accounted for 60% of the spending increase among the top 5% of commercially insured members between 2013 and 2015, and that trend has only accelerated since.
Analytics applied to raw claims data can identify:
- Which members are accumulating risk before high-cost episodes occur
- Which conditions are progressing toward expensive interventions
- Where early outreach has the greatest cost-reduction leverage
Pharmacy: The Fastest-Accelerating Driver
Pharmacy costs — particularly specialty drugs — are now the single most consequential cost driver for most employer health plans:
- Specialty drug trend projected at 13.3% for 2025 (Segal, 2024)
- Outpatient prescription drug trend at 11.4% across the commercially insured market
- The FTC found the three largest PBMs generated an estimated $1.4 billion through spread pricing on specialty generic drugs from 2017–2022
Most employers have no visibility into whether their PBM contract terms are competitive. Without claims-level pharmacy data, benchmarking PBM performance against market alternatives is not possible.
Care Setting Misalignment
HCCI data shows the average ER visit among employer-sponsored insurance members cost $2,256 in 2022 — compared to $220 for urgent care and $224 for a primary care visit. When members use the ER for conditions that could be handled in lower-cost settings, the premium differential is measurable and addressable.
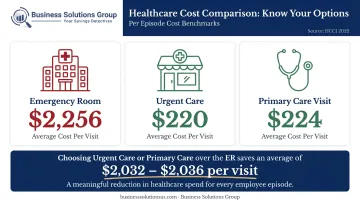
Analytics can quantify exactly how much of a plan's ER spend is potentially steerable, and that figure becomes the business case for building navigation tools or redesigning cost-sharing structures.
Fraud, Waste, and Administrative Leakage
This category is almost entirely preventable — but only detectable through pattern-recognition analysis applied to raw claims:
- Duplicate billing and upcoding that passes through without automated review
- Ineligible dependents remaining on the plan after qualifying events
- Billing for services not rendered, that manual review misses at scale
Mercer data shows dependent eligibility audits typically remove 3%–10% of dependents, with average annual medical cost per dependent exceeding $4,570. A Conduent case study of a 10,000-employee organization found 753 ineligible dependents, representing projected savings of $1.98 million at a 17:1 ROI.
Cost-Reduction Strategies Using Data Analytics
No single analytics strategy works for every employer. The right approach depends on where you are in the plan cycle and what decisions are still in front of you.
Strategies That Change Decisions Before the Plan Year
The choices made before the plan year begins carry the highest leverage on total spend. This is where most of the structural opportunity lives.
Claims benchmarking for plan design: Compare current deductibles, co-pays, network tiers, and out-of-pocket structures against actual utilization patterns and peer-organization benchmarks. Annual renewals don't surface this gap — independent benchmarking does. The core question is the same one that applies to procurement and logistics contracts: what does comparable look like, and where are you paying above market?
Pharmacy formulary and PBM analysis: Raw claims-level pharmacy data can reveal:
- High-cost brand drugs with clinically equivalent generic or biosimilar alternatives
- PBM contract terms not benchmarked against current market rates
- Specialty drug spend accumulating without utilization controls in place
This analysis requires access to pharmacy claims data — which is another reason why the shift away from fully insured models matters.
Dependent eligibility audits: Enrollment and claims data cross-referenced against eligibility criteria can identify dependents who should have been removed after a qualifying event. The savings are concrete, auditable, and typically realized within the current plan year.
Vendor contract accountability: Historical vendor performance data — not just quoted premiums — should drive carrier and TPA contract evaluations. The right question isn't what terms were negotiated, but whether those terms are actually being delivered. Rebates, discounts, and performance guarantees are more often misapplied than employers recognize.
Strategies That Change How the Plan Is Managed
Once the plan year is active, the goal shifts from design to intervention — acting before costs compound rather than after they appear on a renewal invoice.
Predictive risk modeling: Identifying members showing early indicators of high-cost conditions — worsening chronic disease markers, medication non-adherence, increasing ER utilization — allows care management teams to intervene proactively.
The cost difference between early-stage and late-stage management is substantial. The challenge is having the data infrastructure to see those signals in time.
Real-time claims monitoring with anomaly detection: Machine learning tools have made automated FWA detection accessible even for mid-market employers. Flagging unusual billing patterns — upcoding, duplicate submissions, billing for services not rendered — before payment goes out is far more effective than post-payment recovery.
Utilization tracking and care navigation: Continuous monitoring of care setting patterns allows employers to quantify avoidable cost and build targeted responses: navigation tools, cost-sharing differentials, or member communication campaigns that redirect care to lower-cost, equally effective settings.
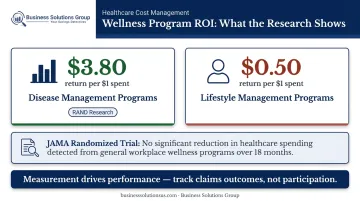
Measuring wellness programs by outcomes, not participation: RAND research found disease management programs return $3.80 per dollar spent, but lifestyle management programs return only $0.50. A subsequent JAMA randomized trial found no significant change in healthcare spending from a workplace wellness program over 18 months. The difference between those findings lies in measurement: programs that track claims outcomes perform differently than those tracking participation rates alone. Analytics should connect interventions to actual utilization and spend changes among targeted member populations.
Strategies That Change the Context Around the Plan
Some of the most impactful analytics decisions are structural — they determine whether meaningful analysis is even possible.
Self-funded vs. fully insured: The shift from fully insured to self-funded (or level-funded) plans is, at its core, a data-access decision. Self-funding gives employers direct access to claims-level data that fully insured arrangements withhold — making every other analytics strategy in this article possible. KFF reports that 67% of covered workers are already in self-funded plans, including 80% at firms with 200+ employees. For smaller employers, level-funded structures now offer a middle path that preserves much of the same data access.
Independent analytics over vendor-provided reporting: Carriers and TPAs have structural incentives that can influence what gets surfaced in their reporting. Unfavorable trend lines, underperforming contract terms, or pharmacy cost acceleration that predates the renewal conversation may not be highlighted prominently. An independent advisor — one with no financial interest in the plan's structure — provides analysis oriented toward the employer's interests, not the vendor's. BSG operates as a fiduciary, fee-based advisor with no product relationships, which is precisely what makes that independence credible.
Regulatory compliance as cost avoidance: Tracking compliance requirements through data goes beyond administrative overhead — it's a cost-avoidance strategy with measurable ROI. Key areas include:
- MHPAEA mental health parity requirements
- ACA reporting deadlines and documentation
- Transparency mandates for price and cost disclosures
Non-compliance creates penalty exposure that compounds plan costs in ways most employers don't anticipate until they're already in violation.
Conclusion
Health plan costs don't become controllable by spending less. They become controllable when employers know precisely where cost originates — which claims are avoidable, which vendor decisions are compounding spend, and which members need intervention before a manageable condition becomes a catastrophic one.
Cutting benefits or shifting costs to employees treats the symptom. It doesn't address the underlying structure that makes health plans expensive in the first place.
Organizations that consistently achieve better plan economics — alongside better employee health outcomes — treat healthcare spend with the same analytical discipline they apply to procurement, logistics, and vendor management. They demand claims-level data, benchmark against peers, and track whether interventions actually reduce cost rather than just generating activity.
Business Solutions Group brings this same cost-intelligence methodology to healthcare that it applies across supply chain, freight, and procurement advisory — starting with a no-cost benchmark analysis to identify where your current plan is leaking value. For employers with 25 or more employees, that conversation starts at businesssolutionsus.com/contact.
Frequently Asked Questions
How can data analytics help reduce healthcare costs?
Analytics identify the specific conditions, care patterns, and plan design inefficiencies driving the majority of spend — allowing employers to intervene before costs compound. Rather than absorbing rate increases at renewal, employers with claims-level visibility can act on what's actually happening inside their plan throughout the year.
What are the four types of data analytics in healthcare?
The four types are descriptive (what happened), diagnostic (why it happened), predictive (what's likely to happen next), and prescriptive (what action to take). Most employers start with descriptive reporting and build toward predictive as their data access and analytical capabilities grow.
What are the 5 C's of data analytics?
The 5 C's are Collection, Cleaning, Contextualization, Communication, and Conversion. Raw health plan data only creates value once it's accurate, benchmarked properly, and translated into specific actions that reduce cost.
What data sources are used in health plan analytics?
The primary sources are medical claims, pharmacy claims, eligibility and enrollment records, lab data, and member survey data. The value of analytics increases significantly when these sources are integrated — analyzing each in isolation misses the cross-category patterns that drive most cost growth.
Should employers outsource health plan analytics or rely on vendor-provided reporting?
Vendor-provided reporting often lacks cross-plan integration and may not surface results unfavorable to the reporting vendor. Independent analytics partners offer a more objective view structured around employer interests, not the carrier's renewal conversation.
How does switching to a self-funded health plan improve analytics capabilities?
Self-funded plans give employers direct access to claims-level data that fully insured models withhold entirely. Without it, predictive modeling, utilization analysis, and targeted member interventions are off the table. Funding structure is a prerequisite for serious cost management, not just an alternative plan design option.