Introduction
Freight shippers are caught in a frustrating bind. Fuel costs swing unpredictably, carrier capacity tightens without warning, and pricing pressure compounds quarterly — yet most companies are still making margin decisions based on reports that are weeks old by the time anyone reads them.
The gap between when freight data is generated and when it's actually used to make decisions is where margin quietly disappears.
According to ATRI, the total operational cost of trucking reached $2.26 per mile in 2024 — and while fuel costs dropped 13%, non-fuel costs like driver wages and insurance rose 3.6%. Shippers can't rely on fuel relief alone to protect margins. That cost creep doesn't reverse on its own.
This article covers how real-time freight data — beyond simple shipment tracking — translates directly into measurable margin protection: through rate benchmarking, invoice accuracy, carrier performance monitoring, and smarter spot-vs-contract decisions.
Key Takeaways
- Real-time freight data gives shippers the intelligence to act before margin is lost, not after
- Key margin levers include route cost optimization, invoice auditing, and spot-vs-contract rate decisions
- Freight spend benchmarking against live market data remains a widely overlooked negotiation tool — most shippers leave money on the table without it
- Invoice audit programs typically recover 2–5% of total freight spend — often visible within the first billing cycle
- Getting started requires no technology overhaul; the right advisory partner finds quick wins inside your existing data
Why Freight Margins Are Under Pressure
The Cass Freight Index shows shipper expenditures surged 38% in 2021 and another 23% in 2022, then fell 19% in 2023 and 11% in 2024. That kind of volatility makes annual budget planning nearly impossible without continuous data.
Meanwhile, structural costs keep climbing. Driver wages, insurance premiums, and equipment costs pushed non-fuel per-mile expenses to $1.779 per mile in 2024 — a record high. The ATA projects the truck driver shortage could exceed 160,000 by 2028–2031, which will sustain upward wage pressure for years.
The Data Lag Problem
Most shippers are losing margin on decisions made from outdated information — not from poor judgment.
Monthly or quarterly freight reports describe what happened. By the time procurement reviews lane-level spend or notices a rate anomaly, weeks of overcharges have already accumulated. Carriers have already moved on to new pricing cycles.
Business Solutions Group sees this pattern consistently across new client engagements: organizations operating with limited market intelligence, manual processes, and no consolidated view of their true freight cost structure — not because the data doesn't exist, but because it isn't integrated or analyzed in time to act on.
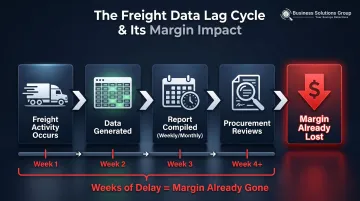
The shippers gaining ground on margins aren't necessarily the largest. They're the ones who've closed the gap between when freight data is generated and when it drives a decision.
What Real-Time Freight Data Actually Looks Like
Real-time freight data is the continuous flow of information across a shipment's entire lifecycle — from planning through payment — not a snapshot that arrives hours or days later. Historical reporting tells you what happened; real-time data lets you act before the cost is already locked in.
The Data Streams That Actually Move the Margin Needle
Not all data streams are equally valuable for margin protection. The ones that matter most:
- GPS/telematics and ELD data — route performance, idle time, actual vs. planned miles
- Live carrier rate indices and load board pricing — current market benchmarks for spot and contract comparison
- Freight invoice and audit data — billing accuracy checked against contracted rates as invoices arrive
- Weather and traffic feeds — proactive rerouting before delays become cost events
- Carrier on-time and acceptance metrics — performance-based carrier selection and volume allocation
Why Integration Is the Critical Step
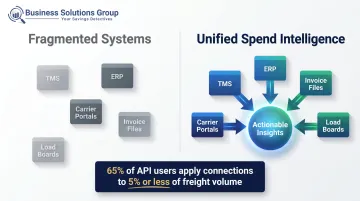
Each of these streams typically lives in a separate system — TMS, ERP, carrier portals, manual invoice files. A 2023 DAT/ISM survey found that while 44% of shippers have API connections to carriers or data platforms, 65% of those users apply them to 5% or less of their total freight volume.
Most shippers already have the technology connections — they just aren't using them at scale. Until those streams feed into a unified view, each data source remains an isolated signal rather than an actionable input.
The Spend Intelligence Layer
Closing that integration gap is what makes spend intelligence possible. This layer captures what a shipper is actually paying — per lane, per carrier, per mode — and compares it against market benchmarks. It's the data layer most directly connected to margin outcomes, and the one most often absent from standard TMS reporting.
How Real-Time Data Directly Improves Freight Margins
Route Cost Optimization
Traditional routing guides are built on historical assumptions. In a volatile market, those assumptions expire fast.
Real-time traffic, weather, and capacity data enable dynamic rerouting that reduces empty miles and fuel burn before costs are incurred. The scale of the problem is significant: approximately 35% of truck miles are empty across the U.S. freight network, costing carriers $1.50–$3.00 per deadhead mile — costs embedded directly into the rates shippers pay.
Real-time optimization recalculates the lowest-cost path given current conditions. Static guides offer no equivalent flexibility.
Freight Invoice Accuracy and Audit
Billing discrepancies are one of the most invisible margin leaks in freight. Industry estimates for freight invoice error rates range from 3% to 25%, reflecting differences in audit methodology and scope — but across that entire range, errors are common and mostly go uncaught without systematic review.
The financial exposure is concrete: audit programs typically recover 2–5% of total freight spend. For a shipper spending $10 million annually on freight, that's $200,000 to $500,000 in recoverable overcharges.
Common discrepancy types caught through real-time auditing:
- Accessorial fees applied without authorization
- Rate mismatches between contract terms and invoice
- Duplicate invoices for the same shipment
- Weight or classification errors
- Late delivery credits not applied
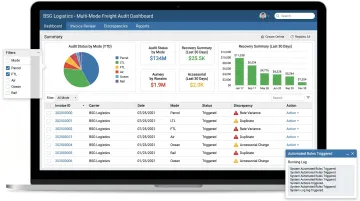
Business Solutions Group's freight audit program reviews every invoice against contracted terms across parcel, LTL, FTL, air, ocean, and rail — and handles carrier recovery directly, so clients see the savings without the administrative burden. Most clients see recoveries within their first billing cycle.
Carrier Performance Monitoring
A carrier's rate is only part of what they cost. Service failures — missed delivery windows, high claim frequency, low load acceptance — generate hidden downstream costs: expedited re-shipments, customer penalties, re-deliveries.
Real-time carrier performance data allows shippers to:
- Continuously score carriers on on-time rates, acceptance, and claim frequency
- Shift volume dynamically toward high performers
- Identify underperforming carriers before service failures accumulate into customer impact
The result is a routing model that responds to actual carrier behavior — not the performance assumptions baked into last year's bid.
Spot vs. Contract Rate Decisions
In 2024, DAT data showed dry van spot rates averaged $1.65/mile versus contract rates at $2.02/mile — a $0.37/mile spread. Shippers locked into annual contracts during that period couldn't capture that difference.
81% of shippers run annual bids, meaning most renegotiate once per year regardless of what the market does between cycles. Real-time rate visibility changes the calculus: shippers can see when spot rates represent a genuine opportunity before tendering a load, rather than defaulting to their routing guide because they have no alternative reference point.
Load Consolidation and Network Optimization
Real-time visibility into shipment volumes, carrier capacity, and delivery windows enables dynamic load consolidation — combining LTL shipments into full truckloads or identifying backhaul opportunities that reduce cost-per-unit without compromising service.
That opportunity is more valuable now than it was five years ago. LTL rates sit 63.8% above the January 2018 baseline — a climb accelerated by Yellow Corporation's 2023 collapse, which removed roughly 10% of U.S. LTL capacity overnight. Every consolidation move has a direct dollar figure attached to it in this market.
Using Real-Time Benchmarking to Negotiate Better Carrier Contracts
Most carrier contract negotiations happen in an information vacuum. Shippers accept proposed rates because they lack independent market comparisons. Carriers know their own cost structures; shippers are working from last year's contract and instinct.
Real-time benchmarking closes that gap.
How Benchmark Data Shifts the Negotiation Dynamic
When procurement enters a rate negotiation with lane-level benchmarks — showing exactly where their current rates deviate from market — carriers sharpen their pricing. The conversation shifts from "this is our rate" to "here's why your rate on this lane is 18% above what comparable shippers are paying."
Consider a practical scenario: a mid-sized manufacturer running high volumes on a Midwest-to-Southeast lane is paying $2.40/mile under a contract signed 14 months ago. Live benchmark data shows comparable lanes clearing at $2.05/mile in the current market. Armed with that specific comparison, their procurement team renegotiates that lane to $2.10/mile — recovering $0.30/mile on a lane moving 500 loads annually. That's $150,000 in annual savings from a single lane renegotiation.

Shippers using benchmarking tools during transportation RFPs typically achieve base rate savings of 4–15% — and that range understates the opportunity for companies that have never benchmarked at all.
How BSG's Spend Intelligence Supports Continuous Benchmarking
Business Solutions Group provides shippers with proprietary spend intelligence tools that surface lane-level market comparisons automatically, measuring what a shipper currently pays against BSG's market-rate intelligence across carriers, lanes, and modes.
Unlike a once-a-year RFP exercise, the platform runs continuously between contract cycles. Key capabilities include:
- Ongoing lane-level monitoring with alerts when spend exceeds market benchmarks
- Rate deviation reports that show exactly where contracts are out of market
- Advisory support to build negotiation strategy and manage carrier conversations directly
- A complimentary benchmark analysis — typically completed within one week — showing savings potential at the lane level before any agreement is signed
This means carrier contracts stop being an annual event and become an active, year-round optimization lever.
A 2025 academic study published in Transport Policy found that freight forwarders negotiate rates 21.3% lower than shippers dealing directly with carriers — a gap driven almost entirely by data asymmetry. Benchmark intelligence is how smaller shippers close that gap without the volume leverage of a major forwarder.
How to Build a Real-Time Freight Data Strategy
Step 1: Audit What You Already Have
Most shippers don't need to start from scratch. Data is already flowing through their TMS, carrier portals, ERP, and freight invoices. The problem is that it isn't integrated, standardized, or analyzed in time to act on.
Before evaluating any new technology, map what data exists and where it lives. This audit identifies both the gaps and the quick wins — places where existing data streams, properly connected, immediately surface actionable insights.
Step 2: Prioritize by Margin Impact
Not every data stream delivers equal return. A phased approach works best:
- Freight spend and invoice data first — highest direct margin impact, fastest ROI
- Carrier performance data second — surfaces hidden service costs and allocation opportunities
- Operational and routing data third — builds toward network-level optimization as data accumulates
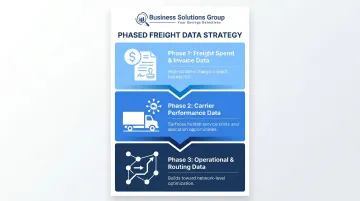
This sequence generates early, visible savings while building toward a complete real-time data environment.
Step 3: Address the Expertise Gap
Real-time data tools are only valuable if the insights they produce drive action. Many shippers — particularly mid-sized operators without dedicated freight analytics teams — have access to data but lack the internal resources to interpret market benchmarks, build negotiation strategies, or translate carrier performance scores into routing decisions.
Business Solutions Group's advisory model addresses this gap directly. Depending on freight spend, support looks different:
- Shippers under $500K/year: BSG provides a TMS rate shopping tool — covering UPS, FedEx, USPS, LTL, FTL, and courier rates in a single dashboard — often at little to no cost
- Larger operations: BSG delivers full TMS functionality (typically a $150,000–$250,000 investment) alongside dedicated advisory support for ongoing interpretation and execution
The model runs on performance-based compensation: BSG's fees are paid by carriers, clients keep 100% of savings, and if savings don't materialize, BSG doesn't get paid. That structure removes the financial risk from getting started.
Frequently Asked Questions
What are examples of real-time data in freight management?
Real-time freight data includes live GPS/telematics feeds, load board rate indices, weather event alerts on active lanes, and carrier tracking updates pushed as status changes occur. It also covers freight invoice data processed as invoices arrive — not batched at month-end.
How does real-time data help reduce freight costs?
Real-time data puts decision-making ahead of the problem. It catches invoice errors before payment clears, supports dynamic load consolidation when capacity aligns, and flags when spot rates are more favorable than contracted rates before a load is tendered.
What is freight spend intelligence and how is it different from standard reporting?
Freight spend intelligence analyzes and benchmarks what a shipper pays across all carriers, lanes, and modes, surfacing margin leakage and negotiation opportunities as they arise. Standard reporting produces a static snapshot of past activity — typically too late to act on.
Can smaller shippers benefit from real-time freight data solutions?
Smaller and mid-sized shippers often benefit most, particularly in carrier negotiations where data levels the playing field against carriers with far more market information. The right advisory partner — like BSG — provides access to market benchmarks and spend intelligence tools without requiring clients to build an internal analytics team.
How long does it take to see margin improvements from real-time data solutions?
Invoice error recovery and initial rate benchmarking typically generate visible savings within the first 30–60 days. Broader gains from route optimization and carrier network restructuring generally materialize within 3–6 months as data accumulates and strategies are refined.
What is the difference between real-time data and historical data in freight management?
Historical data reveals what happened — useful for trend analysis and annual RFP preparation. Real-time data enables decisions in the moment: catching an overcharge before it's paid, selecting a carrier while a load is still being tendered, or rerouting a shipment while it's still moving.