The pressure compounds. Demand volatility strains planning. Carrier markets swing unpredictably. And nine in ten companies reported supply chain challenges in 2024, per McKinsey — yet many responded by cutting inventory buffers rather than addressing the underlying cost structure.
What most organizations miss is that supply chain costs don't spike from a single failure. They accumulate across five distinct operational areas, each with its own cost drivers and reduction strategies. This article identifies all five, explains what builds cost within each one, and outlines how to reduce it.
Key Takeaways
- Supply chain costs consume 50–75% of total business costs — most of it controllable with the right approach
- The five levers are: transportation, inventory, procurement, network design, and demand forecasting
- Costs accumulate silently through aged contracts, excess stock, and fragmented supplier relationships
- Prioritize levers based on where your costs are actually concentrated, not industry averages
- Pulling multiple levers in coordination consistently outperforms isolated optimization efforts
How Supply Chain Costs Build Up
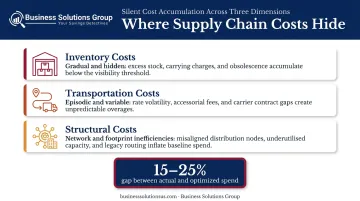
Supply chain costs rarely appear as one large line item. They accumulate through repeated, incremental decisions — a carrier contract left unbenchmarked for three years, safety stock targets that were never revised after a product line matured, a supplier base that fragmented over time as procurement teams added vendors opportunistically.
The pattern differs by function:
- Inventory costs are gradual and hidden — capital tied up in slow-moving stock, insurance premiums, warehouse space consumed by items that aren't moving
- Transportation costs are episodic — fuel surcharges, capacity crunches, accessorial fees that appear line by line on invoices
- Structural costs like network design only surface when a business scales or stress-tests its footprint against current demand patterns
The visibility problem is itself a cost driver. Without granular spend data across modes, suppliers, and facilities, most organizations don't recognize where costs are leaking until the cumulative effect hits margins or cash flow statements. By then, the gap between actual spend and optimized spend commonly runs 15–25% of total logistics costs — a figure that rarely shows up on a single report.
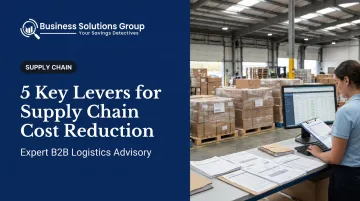
The 5 Key Levers for Supply Chain Cost Reduction
Supply chain cost reduction is more accurately a set of five distinct levers — each addressing a different cost origin. The highest-impact programs identify which levers are most relevant before committing resources, rather than treating every function as equally urgent.
Lever 1: Transportation and Carrier Contract Optimization
Transportation is typically the single largest controllable cost in any supply chain. Much of the overpayment within it doesn't come from market conditions — it comes from contracts that haven't been benchmarked, carrier mixes that haven't been rationalized, and accessorial charges that go unmonitored.
According to Shipware, up to 20% of shipping invoices contain errors, including overcharges, duplicate fees, and incorrect surcharges. A consistent invoice audit program alone can recover 5–8% of total shipping spend. Accessorial charges compound this further — FreightWaves reports they can account for 40% of a typical delivery charge, yet most shippers accept them without scrutiny.
Key reduction strategies:
- Benchmark carrier contracts against current market rates — contracts that haven't been reviewed in 2–3 years almost always diverge from market norms
- Audit carrier invoices systematically to catch erroneous surcharges and duplicate billing
- Consolidate shipments to build volume — then use that concentration to negotiate better rates
- Optimize mode selection — shifting non-urgent parcels from expedited air to ground can reduce per-shipment cost without meaningful service impact
- Renegotiate fuel surcharge structures using market benchmarks rather than accepting carrier-proposed adjustments
Business Solutions Group's proprietary spend intelligence software and carrier benchmarking capabilities identify where transportation costs diverge from market norms and help shippers secure better contracts across parcel and freight without compromising service levels.
Lever 2: Inventory Management and Working Capital Reduction
Inventory carrying costs are consistently underestimated. The Institute for Supply Management places most companies' carrying costs at 20–30% of total inventory value annually when capital, warehousing, insurance, and obsolescence are factored in together. For a business carrying $10M in inventory, that's $2–3M per year in carrying costs — much of it avoidable.
The cash flow dimension is equally significant. J.P. Morgan's 2024 Working Capital Index found that S&P 1500 companies had working capital near a 10-year high, largely driven by excess inventory levels and extended payment cycles.
Strategies that reduce inventory costs without creating stockout risk:
- Segment SKUs by velocity — high-turnover items need active replenishment policies; slow movers need different safety stock treatment
- Reduce safety stock on stable-demand or slow-moving SKUs where overstocking — not stockout — is the actual risk
- Vendor-managed inventory (VMI) — where supplier lead times allow, shift replenishment responsibility to suppliers
- Schedule regular inventory health reviews to identify and liquidate obsolete or dead stock before write-down costs accumulate
One caution: inventory reduction without improved demand visibility creates stockout costs and service failures that can exceed the original carrying cost savings. The goal is holding the right stock in the right location — not simply holding less.
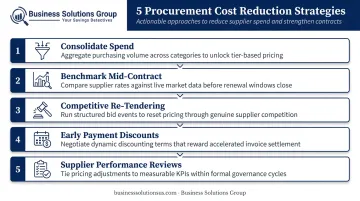
Lever 3: Procurement and Supplier Strategy
Procurement cost reduction operates on two dimensions: pricing (are you paying market rates?) and structure (does your supplier base give you negotiating power?).
Fragmented spend is the structural problem most organizations underestimate. According to a 2025 Hackett Group study, tail spend represents 20% of enterprise spend spread across 80% of suppliers — and only 4% of companies actively manage most of it. The potential savings from addressing tail spend are 16–20%, but most companies currently capture only 7–10%.
McKinsey's research on mid-size industrial companies adds another dimension: inefficient sourcing contributed to their margins plateauing 30–40% below peers.
Procurement reduction strategies:
- Concentrate spend with fewer, strategically selected suppliers to unlock volume-based pricing and cut administrative overhead
- Benchmark mid-contract — companies that wait until contract expiry to review pricing consistently leave value on the table; proactive benchmarking often surfaces renegotiation opportunities without a full re-tender
- Run competitive re-tendering on categories where pricing hasn't been tested against the market in 18+ months
- Implement early payment discount programs where cash flow permits, converting payment terms into a cost reduction mechanism
- Establish formal supplier performance reviews to ensure contract terms are honored and identify where consolidation remains possible
Business Solutions Group's eProcurement solutions support clients in structuring supplier strategy and conducting the benchmarking exercises needed to validate whether current contract pricing reflects market conditions.
Lever 4: Network Design and Facility Efficiency
Network design is the most structurally impactful supply chain lever — and the longest-cycle one. Where distribution centers are located, how many facilities operate, and how warehouse workflows are configured determine a substantial share of fixed and variable costs for years at a time.
Most companies aren't dealing with a bad network decision — they're dealing with an old one. As customer locations shift, product mixes change, or volume patterns evolve, a network built for a previous version of the business quietly inflates costs.
Logistics Bureau estimates that supply chain analytics and network optimization can deliver 10–25% reductions in transportation costs and 15–30% reductions in inventory holdings while maintaining service levels. McKinsey's data on AI-enabled distribution optimization suggests a similar range: 5–20% logistics cost reductions and 20–30% inventory reductions.
Network optimization strategies:
- Assess whether DC locations still align with current customer density and freight lane economics before committing to any facility changes
- Evaluate 3PL partnerships as an alternative to owned or leased capacity, particularly for managing peak demand without carrying year-round fixed costs
- Redesign warehouse layouts to improve throughput per square foot and reduce labor cost per unit
- Rationalize the facility footprint where overlapping or underutilized sites are identified
Network changes carry long payback horizons, so prioritization should be data-driven. Companies that invest in a current-state network assessment before committing capital avoid the common mistake of optimizing a facility that should have been consolidated.
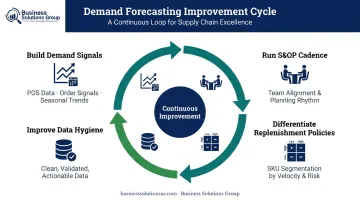
Lever 5: Demand Forecasting and Planning Accuracy
Demand forecasting is an upstream lever — its accuracy (or inaccuracy) multiplies costs downstream across every other lever. Poor forecasts generate excess inventory or stockouts, trigger emergency transportation, require unplanned production runs, and create overtime labor costs. Fix forecasting, and several other cost problems become easier to manage.
McKinsey's research on AI-driven forecasting quantifies the downstream impact: improved forecast accuracy can reduce lost sales and product unavailability by up to 65%, cut warehousing costs by 5–10%, and reduce administration costs by 25–40%.
Forecasting improvement strategies:
- Use point-of-sale data, customer order signals, and seasonal trend modeling — not just historical averages — to build demand signals that reflect actual buying behavior
- Run a formal S&OP cadence to align commercial, operations, and procurement teams on a single demand signal — this eliminates the version-control problem that quietly inflates safety stock
- Apply different replenishment policies to high-velocity predictable items versus slow-moving or highly variable SKUs — treating them identically is where forecast error compounds
- Improve data hygiene before investing in new tools — technology can accelerate forecasting accuracy, but process discipline and clean data are the real constraints; even without advanced software, a consistent S&OP cadence meaningfully reduces forecast error
The payoff from forecasting improvement isn't just inventory reduction — it's the compounding effect of better inputs flowing into transportation planning, procurement timing, and facility utilization decisions.
Conclusion
Reducing supply chain costs isn't a blanket exercise. The right starting point depends entirely on where cost is originating in a specific operation. A business with primarily transportation spend should pull a different lever first than one where excess inventory is the primary profit drain.
Identifying that origin point — through spend data, operational benchmarking, and honest assessment against market norms — is always the first move.
Once that origin point is clear, the most durable savings come from treating these five levers not as one-time projects but as ongoing management disciplines. Companies that build systematic visibility into transportation spend, inventory health, supplier pricing, network efficiency, and forecast accuracy find and close cost gaps continuously — turning supply chain cost from a recurring problem into a managed, measurable outcome.
Business Solutions Group supports this kind of sustained cost reduction through proprietary spend intelligence software, carrier contract benchmarking, and eProcurement capabilities. The firm works with parcel shippers, freight shippers, and businesses across industries to identify where cost is leaking and close those gaps across all five levers.
Frequently Asked Questions
What are the 5 levers of supply chain cost reduction?
The five levers are transportation and carrier management, inventory and working capital, procurement and supplier strategy, network and facility design, and demand forecasting and planning. Each represents a distinct category of controllable cost with different drivers and reduction strategies.
What are the 5 C's of supply chain management?
The 5 C's framework is commonly defined as Cost, Capacity, Control, Compliance, and Continuity. It's a complementary lens to the five cost levers, addressing structural resilience and governance rather than specific cost reduction tactics.
How do you identify which supply chain cost lever to prioritize?
Start with spend analysis: identify where the largest dollar amounts are concentrated and where costs are growing fastest. Companies with high transportation spend should address carrier contracts first, while those with significant working capital constraints typically benefit most from tackling inventory.
What is the biggest cost driver in supply chain management?
Transportation is typically the largest single cost category, historically accounting for the majority of total logistics spend. However, this varies by industry, and for asset-heavy manufacturers, facility and labor costs can rival transportation in scale.
How much can companies save by optimizing supply chain costs?
Savings depend heavily on which levers have been optimized and the current maturity of the operation. Network optimization alone can yield 10–25% transportation cost reductions, per Logistics Bureau. Carrier contract benchmarking typically recovers 5–8% of shipping spend through invoice audits alone, with additional savings from renegotiation.