The pattern is familiar: a cost reduction initiative launches, early wins get reported, and then margins quietly erode again within 18–24 months. McKinsey research puts the broader transformation failure rate at 70% — and supply chain programs are no exception. The reason is usually the same: companies address symptoms rather than causes.
This article presents 8 real-world case studies — Deere, Intel, Starbucks, AGCO, Terex, Avaya, Sunsweet Growers, and Walmart — with the specific cost levers each company pulled, the measurable results they achieved, and the structural patterns any operations leader can apply to their own situation.
Key Takeaways
- Supply chain costs build up through structural decisions and unchecked complexity, rarely from a single event
- The 8 companies here reduced costs by addressing root causes, not trimming line items
- The most common cost levers across these cases were network redesign, inventory strategy, technology integration, and 3PL rationalization
- Sustainable savings require phased execution and clear accountability
- Diagnosing your highest-leverage cost driver before acting is the critical first step
Why Supply Chain Costs Keep Rising
Supply chain costs rarely spike. They compound — gradually, through decisions that each seemed reasonable at the time.
Organic growth adds distribution points. Acquisitions bring incompatible systems and duplicate supplier relationships. Piecemeal outsourcing creates 3PL contracts that made sense in isolation but generate redundancy at scale. By the time the margin pressure becomes undeniable, the root causes are buried inside years of operational decisions.
The Complexity Multiplier
Every new SKU, carrier relationship, warehouse location, or distribution channel adds a layer of coordination cost. McKinsey research on product complexity shows these hidden costs — larger inventories, additional development hours, returns, and warranty claims — can grow exponentially as variants accumulate.
No individual decision looks expensive in isolation. The damage accumulates across hundreds of small choices, and by the time margins feel the pressure, the pattern is already years in the making.
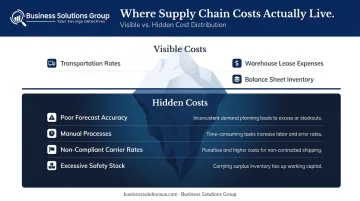
Visible vs. Hidden Costs
Most cost reduction efforts fail because they target the visible layer:
- Visible costs: Transportation rates, warehouse lease expenses, inventory on the balance sheet
- Hidden costs: Poor forecast accuracy, manual processes, non-compliance with contracted carrier rates, excessive safety stock held because planning is unreliable
Companies that renegotiate carrier rates without fixing underlying forecasting or network structure typically recover 2–3% in savings, then watch costs drift back within a year. The eight companies profiled below addressed root causes — restructuring networks, improving planning accuracy, and eliminating the process failures that made surface-level savings temporary.
8 Supply Chain Cost Reduction Case Studies
Deere & Company: Network Redesign That Eliminated $1 Billion in Inventory
The problem: Deere's Commercial and Consumer Equipment division was running a costly replenishment operation using direct shipment and cross-docking from source warehouses. The model was too slow and too expensive for a business with extreme seasonal demand peaks. Deere set a specific target: 10% transportation cost reduction over four years.
What they did: Deere commissioned intermediate merge centers, optimized cross-dock terminal locations using software to identify the right network configuration, consolidated seasonal shipments, and expanded 3PL usage.
The results:
- $1 billion in inventory removed from the network
- Deliveries within 3 days or less improved from 65% to 89%
- On track toward the 10% multi-year transportation cost target
The insight: Renegotiating carrier rates on a broken network would have moved the needle by single digits. The billion-dollar result came from rebuilding the network itself.
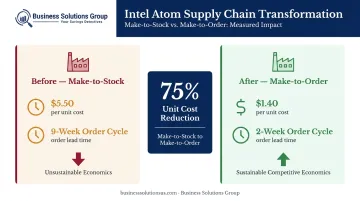
Intel: Supply Chain Cost Per Unit Cut from $5.50 to $1.40
The problem: Intel's Atom chip sold at approximately $20. The existing supply chain cost of $5.50 per unit made the product's economics unworkable. Service levels, packaging, and distribution costs had little room to move. The only real lever was inventory.
What they did: Intel piloted a make-to-order model at an Asian production facility, iteratively eliminating cycle time inefficiencies through repeated process improvements.
The results:
- Order cycle compressed from 9 weeks to 2 weeks
- Supply chain cost per unit reduced from $5.50 to approximately $1.40 — a 75% reduction
The key takeaway: Switching from make-to-stock to make-to-order was the structural change that drove a 75% unit cost reduction. No carrier negotiation produces that kind of outcome.
Starbucks: $500 Million Saved by Restructuring the Function, Not Cutting the Budget
The problem: Between October 2007 and October 2008, Starbucks' US supply chain expenses rose from $750 million to more than $825 million — a $75 million increase during a period when sales were falling. Fewer than 50% of deliveries were arriving on time. The root cause was organizational: supply chain functions were fragmented, 3PL partnerships were poorly governed, and accountability was diffuse.
What they did: Starbucks reorganized supply chain into four functions — Plan, Source, Make, Deliver — added a new production facility, rationalized underperforming carrier relationships, and introduced weekly scorecards tracking service, cost, and productivity against renewed SLAs.
The results:
- More than $500 million in savings cited over the following two years
- On-time delivery performance recovered significantly
What this means: Formal governance — scorecards, renewed SLAs, clear accountability — turned a fragmented operation into a $500 million savings story. Cutting rates without fixing the structure would have changed nothing.
AGCO: 28% Inbound Logistics Cost Reduction Through TMS and Centralization
The problem: AGCO's growth through acquisitions left it with a fragmented supply chain — separate teams managing inbound logistics by country, different tools, no shared visibility, and no economies of scale. There was genuine savings potential, but no one could see it clearly enough to capture it.
What they did: AGCO deployed a globally integrated TMS and partnered with 4flow to build a logistics control tower in Europe, creating centralized visibility across previously siloed operations.
The results:
- 18% freight cost reduction reported within the first phase
- 28% inbound logistics cost reduction after global rollout
- 25% network performance improvement
The lesson: Visibility came before savings. Once the control tower existed, AGCO could see what to negotiate, what to consolidate, and where the waste actually lived.
Terex: 70 Weeks of Annual Labor Savings from RFID Yard Tracking
The problem: Terex AWP was using a manual wallboard-and-sticker system to locate units in its transfer center yard. Finding a single unit took 6 minutes . Physical inventory counts consumed significant monthly hours on top of that.
What they did: Terex replaced the manual system with RFID-based yard management software, piloting it in a small section of the yard before full rollout — a low-risk approach that confirmed ROI before full rollout.
The results:
- Unit location time dropped from 6 minutes to 30 seconds
- Approximately 70 weeks of labor saved per year
The insight: At hundreds of lookups per day, six minutes per unit adds up to 70 weeks of lost labor annually. The RFID fix cost a fraction of that — and the pilot model meant Terex knew the ROI before committing to full deployment.
Avaya: Supply Chain Spend Cut in Half Through Process Transformation
The problem: Multiple acquisitions left Avaya with redundant processes, excess inventory, and a long cash-to-cash cycle. No single system or initiative could fix it — the problem was structural across people, process, and technology simultaneously.
What they did: Avaya undertook a multi-year program of process standardization, culture change, talent investment, and KPI governance, deploying tools including Kinaxis RapidResponse and Coupa to support the transformation.
The results:
- Annual supply chain expense reduced by $125 million — a 50% decrease
- Net inventory cash fell 94% to $181 million
- Inventory turns improved 224%, from 5.8 to 13.0
- On-time shipment improved from 78% in 2010 to 97% by 2017
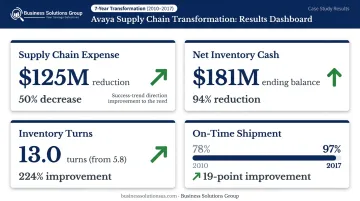
The insight: Avaya's results took seven years of process discipline, culture change, and talent investment. The software supported that work — it didn't replace it. Companies that buy the tool expecting the outcome skip the step that actually produces it.
Sunsweet Growers: Better Forecasting Eliminated 20 Warehouses
The problem: Sunsweet's high production costs traced back upstream to forecasting — a manual, spreadsheet-based process that inflated inventory, caused overtime, drove finished-goods spoilage, and forced the company to maintain 28 US warehouses to buffer against demand uncertainty.
What they did: After evaluating approximately 30 software options, Sunsweet deployed a supply chain planning suite in phases alongside a formal S&OP program — fixing the planning function before expecting downstream cost improvements.
The results:
- Forecasting accuracy improved 15–20%
- Overtime fell from 25% to 8%
- Finished-goods spoilage reduced by 30%
- US warehouse count dropped from 28 to 8
Bottom line: Twenty warehouses existed to absorb bad forecasts. Fix the forecasts, and the warehouses become unnecessary. That's the difference between treating symptoms and solving the actual problem.
Walmart: 40% Reduction in Per-Order Delivery Cost Through Automation and Density
The problem: As e-commerce order volumes scaled, Walmart's legacy distribution model couldn't sustain per-order economics. Routes lacked density, fulfillment was largely manual, and the cost structure didn't hold at volume.
What they did: Walmart expanded delivery-enabled stores to increase route density, scaled automated fulfillment centers to handle over 50% of e-commerce volume, and launched AI-powered route optimization software that optimizes driving routes, trailer packing, and miles simultaneously.
The results:
- US net delivery cost per order reduced by 40% for three consecutive quarters in FY2025
The insight: Route density without automation still leaves money on the table. Automation without density does too. Walmart's 40% reduction came from pursuing both at the same time — a deliberate choice, not a coincidence.
What These Case Studies Have in Common
Across all eight companies, a few patterns hold consistently.
Four patterns show up across every case:
Structural decisions, not marginal tweaks. Each company made at least one genuinely uncomfortable change. Deere redesigned its network. Intel scrapped its existing production model. Starbucks reorganized the function entirely. Avaya changed the culture. Companies that try to replicate these results by optimizing around the edges fall short — because the results came from structural decisions, not incremental ones.
Diagnosis before action. From Deere to AGCO, every company first identified specifically where cost was originating — not by targeting the most visible line item, but by tracing root cause. McKinsey's research on supply chain benchmarking makes the same argument: granular benchmarks reveal value that high-level comparisons miss entirely. That clarity determined where to prioritize before resources were committed.
Phased implementation. None of these transformations happened in a single program:
- Deere targeted a four-year cost reduction horizon
- Starbucks measured results over two years
- Avaya ran a multi-year process and culture transformation
- Sunsweet implemented its planning suite module by module
Phasing lets companies lock in savings from one initiative before funding the next. It also reduces execution risk — each phase becomes a proof point, not a leap of faith.
Strategy before technology. In every successful case, technology served a strategy that had already been defined. AGCO built TMS capability after deciding to centralize. Avaya deployed Kinaxis after committing to process standardization. Companies that buy a TMS or planning platform before fixing the underlying strategy see minimal ROI. That sequencing error is the most common reason organizations invest in the same tools and get none of the same results.
How to Start Reducing Your Own Supply Chain Costs
The first step is spend visibility — not carrier renegotiation, not technology investment, and not network modeling. Before any of those actions can be prioritized correctly, companies need a clear picture of where money is actually going across functions, modes, and partners.
Most companies underestimate their true logistics spend because costs are siloed across departments and vendors. A freight invoice running through accounts payable, a 3PL contract sitting in operations, and a fuel surcharge buried in a carrier accessorial schedule are all part of the same cost structure. They're rarely visible in the same view.
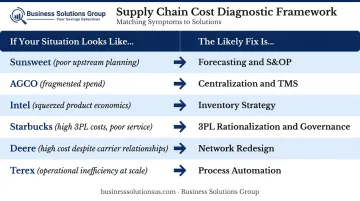
Use the Case Studies as a Diagnostic
The eight companies above offer a useful diagnostic framework:
| If your situation looks like... | The likely fix is... |
|---|---|
| Sunsweet — high downstream cost, poor upstream planning | Forecasting and S&OP |
| AGCO — fragmented spend with no cross-functional visibility | Centralization and TMS |
| Intel — product economics are squeezed by supply chain cost | Inventory strategy |
| Starbucks — high 3PL costs with poor service outcomes | 3PL rationalization and governance |
| Deere — high cost despite carrier relationships | Network redesign |
| Terex — operational inefficiency at scale | Process automation |
Once you've identified where your cost problem sits, the question becomes sequencing. Carrier contract benchmarking is often the right first move — not because it solves structural problems, but because it delivers quick wins while longer-term initiatives are being scoped.
Where Carrier Benchmarking Fits
Many US shippers are paying above-market rates not because their carriers are uncompetitive, but because contracts haven't been renegotiated against current market data.
Business Solutions Group's carrier benchmarking process does exactly this: it identifies where parcel and freight rates diverge from current market benchmarks, then supports negotiation using actual invoice data rather than estimates. Engagements typically run 6–8 weeks from invoice analysis through contract implementation, with measurable cost reductions reflected in the P&L before the project closes.
The key distinction from a structural transformation: benchmarking captures what's available now. But if the diagnosis reveals that your cost problem is in network design or inventory strategy, benchmarking alone won't solve it. Use it as a first step, not the full program.
Conclusion
Supply chain cost reduction starts with diagnosis, not negotiation. The companies that achieved lasting results in these case studies — 40% per-order cost reductions, 50% total expense reductions, $1 billion in inventory removed — did so because they correctly identified where their cost problem lived before acting.
The range of results is wide: modest, targeted initiatives deliver low-single-digit savings, while enterprise-level structural transformations produced reductions of 18% to 50% depending on scope and starting point. Timeline follows a similar pattern — carrier renegotiations can show up in the P&L within months, while network redesign and S&OP implementations typically take 1–3 years to fully realize.
These results came from structured, phased, root-cause-driven programs — not from companies with exceptional resources. The consistent factor across every case was starting with the right question: where is the cost actually coming from? That answer shapes everything else.
Frequently Asked Questions
What is an example of a supply chain cost reduction goal?
A concrete example: reducing per-unit logistics cost from $5.50 to under $1.50 within two years (as Intel did), or cutting inbound freight spend by 20% over 18 months through TMS implementation and carrier consolidation. The most effective goals tie a specific cost metric to a defined timeframe and a named lever.
What percentage of supply chain costs can realistically be reduced?
Results vary by starting point and scope. The case studies here range from targeted freight savings of around 18% (AGCO's initial phase) to 50% total expense reduction (Avaya's multi-year transformation). Narrowly scoped initiatives — like carrier renegotiation — deliver low-single-digit to 15–30% savings on that specific spend category.
How do companies reduce supply chain costs without sacrificing service levels?
The case studies show that cost and service often move in the same direction when root causes are addressed. Deere reduced costs while improving on-time delivery; Walmart cut per-order costs and expanded fulfillment capacity at the same time. Structural fixes — unlike blunt cost-cutting — tend to improve both.
What is the most common cause of high supply chain costs?
Complexity — driven by organic growth, acquisitions, and uncoordinated expansion — is the most consistent underlying cause. It manifests differently across companies: poor forecasting visibility, excess safety stock, fragmented carrier contracts, or redundant 3PL relationships. The symptoms differ, but the root is the same: structural complexity that built up faster than it was managed.
How long does it typically take to see results from supply chain cost reduction?
Carrier contract renegotiation and eliminating redundant 3PL relationships can deliver savings within 2–3 months. Structural changes — network redesign, TMS implementation, S&OP programs — take 1–3 years to fully realize. A phased approach captures both: early wins fund the longer-term work.