Introduction
U.S. business logistics costs hit $2.6 trillion in 2024—8.7% of national GDP, according to the CSCMP's 36th Annual State of Logistics Report. For individual businesses, that national figure translates into a direct margin problem: median supply chain costs run 10–12% of revenue, while top-performing organizations hold that figure to 4–5%, per PwC/ASCM SCORmark benchmarking data.
That gap isn't inevitable. Many supply chain costs aren't fixed—they're the product of suboptimal decisions, limited visibility, or structural misalignment that compounds month after month. For small parcel and freight shippers operating on thin margins, even a 2–3% improvement in supply chain cost as a percentage of revenue can meaningfully change what's available for reinvestment or growth.
This article examines supply chain cost reduction through three distinct lenses: upstream sourcing and procurement decisions, day-to-day operational management, and the structural context the chain operates within. Each requires a different set of strategies. Conflating them is one of the most common reasons cost-reduction efforts stall.
Key Takeaways
- Supply chain costs accumulate across procurement, transportation, inventory, and warehousing — often undetected until they hit a material threshold
- Top 2026 cost drivers: tariff exposure (U.S. effective rates hit 16.8% in late 2025), carrier rate inflation, inventory imbalances, and fragmented spend data
- Effective cost reduction targets the source: decisions, operational management, or structural environment
- Spend visibility and benchmarking are now foundational to any durable savings program
- Sustained cost reduction requires continuous effort, not periodic budget cuts
How Supply Chain Costs Typically Build Up
Supply chain costs don't arrive as a single invoice. They accumulate in layers—sourcing, transportation, warehousing, inventory carrying, and last-mile delivery—each adding incrementally until the combined drag becomes visible in a margin report or audit.
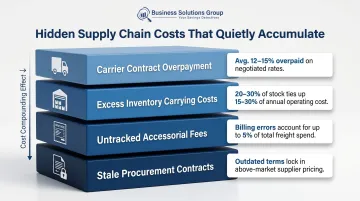
Each layer compounds the next, and most of it happens quietly:
- A carrier contract negotiated without market data quietly inflates freight spend each quarter
- Excess inventory—estimated at 20–30% of total stock in a typical company—ties up working capital at carrying costs of 15–30% of inventory value annually
- Untracked accessorial fees on parcel shipments—dimensional weight errors, misapplied surcharges, duplicate charges—accumulate into significant annual overcharges (up to 5% of UPS and FedEx invoices contain billing errors, according to Zero Down Supply Chain Solutions)
- Procurement contracts left unrenegotiated beyond their market window lock in above-market pricing with no automatic correction mechanism
Most of these costs stay hidden until a financial audit or rate spike surfaces them. By that point, they've already compounded—which is exactly why reactive management consistently underperforms.
Key Cost Drivers Shaping Supply Chain Expenses in 2026
Carrier Rate Inflation
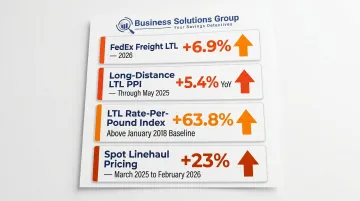
Transportation costs are under sustained upward pressure. Key rate benchmarks tell the story:
- FedEx Freight LTL rates increased an average of 6.9% for 2026
- The long-distance LTL Producer Price Index rose 5.4% year-over-year through May 2025
- The LTL rate-per-pound index sits 63.8% above its January 2018 baseline
- Spot linehaul pricing climbed over 23% from March 2025 through February 2026
This isn't a temporary spike. Carrier consolidation in the LTL market has created structural pricing discipline, meaning rates rise even when volume softens.
Tariff and Trade Policy Exposure
The U.S. effective tariff rate reached 16.8% in late 2025, up from 2.4% at the start of the year — the highest level since 1935, per Yale Budget Lab.
Tariffs on Chinese imports approached 50% by year-end, and real U.S. imports from China fell 28% during 2025. For businesses with concentrated sourcing in high-tariff regions, landed cost calculations from 12 months ago are now materially wrong.
Inventory Imbalances and Forecasting Gaps
Global inventory distortion—overstock and out-of-stock combined—costs businesses $1.77 trillion annually. Both conditions generate cost: excess inventory through carrying costs and obsolescence, insufficient inventory through expedited freight and lost sales.
Fragmented Spend Data
Without consolidated visibility into supply chain spend, businesses can't identify anomalies, track savings initiatives, or prepare for vendor negotiations. 42% of executives cite a lack of real-time data as their primary limitation when responding to supply chain disruptions. Fragmented data is also a negotiation liability: you can't challenge a rate you can't see.
Cost-Reduction Strategies for Supply Chain
Effective cost reduction depends on correctly identifying where costs originate. Strategies that work on procurement decisions don't fix operational inefficiencies—and neither addresses structural network problems. The three categories below map strategies to their appropriate origin points.
Strategies That Reduce Costs by Changing Decisions
These approaches address choices made before goods move: sourcing, contracting, supplier selection, and procurement alignment.
Carrier Contract Renegotiation and Benchmark-Driven Rate Optimization
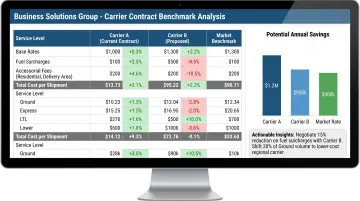
Most businesses—particularly small parcel and freight shippers—operate under outdated carrier agreements because they lack the market data to challenge rates. Benchmarking current contracts against actual market rates reveals overpayment and creates documented leverage for renegotiation.
Companies that benchmark and renegotiate typically achieve 10–25% reductions in transportation costs. Small to midsize shippers often recover 15–30% through audit recovery, surcharge control, and optimized terms.
Business Solutions Group's no-cost benchmark analysis examines base rates, surcharges, and accessorial fees by service level, destination, and weight—then compares them against market rates for similar shipping profiles. Most companies identify 10–30% in actionable savings, with a typical engagement running 6–8 weeks from benchmarking through implementation.
Supplier Consolidation and Volume Leveraging
Fragmented spend across too many suppliers prevents volume-based pricing. Consolidating vendor spend typically involves three steps:
- Auditing current vendor relationships to identify fragmentation
- Consolidating spend with preferred suppliers to unlock volume pricing
- Establishing tiered agreements tied to volume commitments
This reduces both unit and transaction costs without changing what you're buying.
Sourcing Diversification to Reduce Tariff Exposure
With average U.S. tariffs on Chinese imports approaching 50%, single-origin sourcing from high-tariff regions carries both cost risk and supply risk. Shifting portions of sourcing to lower-tariff geographies or nearshore partners can reduce landed cost. U.S. reshoring activity reflects this pressure—244,000 manufacturing and FDI jobs were announced in 2024, with tariffs cited as a reshoring motivator in 454% more cases in early 2025 versus 2024.
The trade-off is real: U.S. manufacturing costs remain 10–50% higher than offshore alternatives. The decision requires a full landed-cost analysis, not just a tariff comparison.
SKU Rationalization and Demand-Aligned Procurement
Broad product catalogs decoupled from actual demand signals generate excess inventory, higher carrying costs, and wasted purchasing capacity. Aligning procurement to real demand data—and pruning low-velocity SKUs—reduces both procurement overhead and inventory costs simultaneously. Companies addressing inventory inefficiencies can reduce working capital by 25–50% within 18 months.
Strategies That Reduce Costs by Changing How the Supply Chain Is Managed
Once goods are moving, cost control shifts to visibility, routing, and forecasting. These approaches improve performance without requiring structural changes to the underlying network.
Real-Time Spend Visibility and Intelligence-Driven Cost Monitoring
Without consolidated, real-time visibility into supply chain spend, cost anomalies go undetected and negotiations go unprepared. Business Solutions Group's proprietary spend intelligence platform manages over $3 billion in parcel spend and has helped clients achieve more than $350 million in annual savings. The platform delivers over 40 actionable insights through consolidated dashboards—teams can drill into cost categories, verify discount accuracy, and surface billing discrepancies, typically within three to five clicks.
For businesses running disconnected data across carriers, ERPs, and WMS platforms, consolidating that data is the prerequisite. Accurate spend intelligence isn't possible until the underlying data feeds are unified.
Transportation Mode and Route Optimization
Transportation accounts for 60–70% of total logistics costs—making it the largest controllable cost category in most supply chains. Analyzing shipment patterns, carrier performance, and route efficiency uncovers:
- Redundant shipments that could be consolidated
- Over-engineered transit modes for the service requirement
- Accessorial charges inflating per-unit freight cost without adding service value
A Transportation Management System (TMS) with integrated carrier performance tracking and post-shipment audit capabilities can reduce total freight spend by 5–15%, with a typical payback period around 14 months.
Inventory Positioning and Safety Stock Calibration
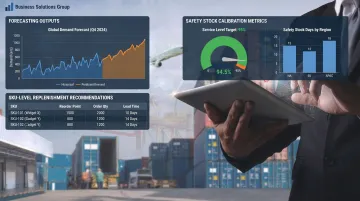
Both excess and insufficient inventory generate costs—just different ones. Data-driven safety stock modeling calibrated by SKU velocity, lead time variability, and demand seasonality reduces carrying costs while maintaining service levels. Business Solutions Group's demand and inventory planning software applies over 280 algorithms to support accurate forecasting and optimal replenishment positioning.
Predictive Analytics for Demand Forecasting
Reactive supply chain management forces expensive responses: emergency sourcing, expedited shipping, last-minute contract changes. Even a 5–10% improvement in forecast accuracy produces meaningful bottom-line impact through reduced safety stock, fewer expedited shipments, and lower obsolescence. A 1% improvement in forecast accuracy translates to a 1–2% reduction in inventory-related costs—modest percentages that compound significantly at scale.
Strategies That Reduce Costs by Changing the Context Around the Supply Chain
Some costs can't be fixed through better decisions or tighter operations—they're baked into the network itself. These approaches address the structural environment: network design, technology infrastructure, and supplier relationships.
Network and Distribution Footprint Redesign
Warehouse locations, the number of distribution nodes, and owned-versus-third-party logistics infrastructure have lasting impacts on transportation and handling costs that no operational tweak can fully offset. Network analysis frequently reveals geographic misalignment between inventory positioning and demand centers.
One case highlighted by Bain shows that consolidating from 14 distribution centers to 9 reduced costs by more than 20% while improving service levels. A home accessories company cut total distribution and transportation costs by 15% within one year through network redesign alone.

End-to-End Technology Integration
Disconnected systems—separate TMS, WMS, procurement platforms, and ERP—create data silos that prevent coordinated cost control and force manual reconciliation. Integrating these functions eliminates redundant processes, reduces transaction costs, and enables enterprise-wide spend governance.
Business Solutions Group's TMS platform integrates with WMS, ERP, and accounting software through an open RESTful API, functioning as a data warehouse for advanced analytics and historical shipment reporting. WMS-ERP integration can reduce inventory variances from typical rates of 5–15% down to under 1%.
Tariff Engineering and Trade Compliance Optimization
Companies that treat tariff structure as a cost management function—not just a legal obligation—consistently achieve lower landed costs. Practical approaches include:
- Country-of-origin classification review
- Free trade agreement utilization (FTA utilization averages only 67% in the first year of a treaty, leaving meaningful savings uncaptured)
- Strategic sourcing shifts away from high-tariff geographies
Supplier Collaboration and Joint Cost-Reduction Programs
Arms-length supplier relationships prevent access to innovation, process improvement, and risk-sharing opportunities. Structured supplier development programs—shared forecasting, joint process mapping, performance-linked agreements—reduce costs on both sides of the relationship. Suppliers operating under shared performance incentives are also more likely to flag potential disruptions early, reducing the frequency of costly emergency responses.
Conclusion
Reducing supply chain costs in 2026 starts with accurate diagnosis. Generic cost-cutting pressure applied uniformly across the supply chain rarely produces lasting results—and often introduces new risks by cutting capacity or redundancy that exists for a reason.
The businesses that consistently outperform on supply chain cost build ongoing visibility into their spend, negotiate from data rather than guesswork, and revisit their supply chain structure before problems force them to.
That means benchmarking carrier contracts against current market rates, maintaining real-time spend intelligence across freight categories, calibrating inventory to actual demand signals, and treating tariff exposure as an active management variable rather than a background condition.
When cost reduction shifts from a periodic exercise to a continuous capability, savings compound — and the supply chain itself becomes harder for competitors to replicate. For businesses ready to build that capability, working with an advisory partner that brings benchmark data and spend intelligence from day one can close the gap significantly faster than building it internally from scratch.
Frequently Asked Questions
How can I reduce supply chain costs?
Start with visibility—audit where costs originate across procurement, transportation, inventory, and warehousing. Then apply targeted strategies to the highest-impact areas: carrier contract renegotiation, spend consolidation, inventory optimization, and demand-driven procurement. Benchmark-driven analysis typically surfaces 10–30% in actionable savings that go undetected without structured auditing.
What is the supply chain strategy in 2026?
Leading supply chain strategies center on resilience, visibility, and cost efficiency—combining supplier diversification, nearshoring, predictive analytics, and technology integration. The goal is a supply chain that runs lean under normal conditions and holds steady when disruptions hit, without requiring costly emergency responses.
What are the 5 C's of SCM?
The 5 C's of supply chain management are Cost, Control, Compliance, Communication, and Collaboration. Together, they provide a framework for evaluating supply chain performance across financial, operational, and relationship dimensions—each reinforcing the others when managed well.
What are the 7 C's of SCM?
The 7 C's framework extends the original five to include Customer and Capacity—or in logistics-focused versions: Connect, Create, Customize, Collaborate, Consolidate, Control, and Coordinate. It adds a customer-facing lens that the 5 C's model doesn't explicitly address.
What is the biggest cost in a supply chain?
Transportation and logistics typically represent the largest single cost category—60–70% of total logistics costs in most supply chains—followed by inventory carrying costs (15–30% of inventory value annually) and procurement overhead. The exact breakdown varies by industry and business model.
How do you measure supply chain cost reduction?
Track total supply chain spend as a percentage of revenue, then compare against the PwC/ASCM benchmark range (median 10–12%, best-in-class 4–5%). Category-level metrics—freight cost per unit, inventory carrying rate, procurement savings versus baseline—confirm whether gains are genuinely competitive or merely incremental.