Relying on spreadsheets or basic invoice tracking in this environment isn't just inefficient — it's expensive. When each carrier invoice has become, as one logistics team described it, "a puzzle of unpredictable charges," reactive budgeting consistently leaves money on the table.
This guide covers the best freight cost forecasting and reporting tools available in 2026, evaluated for forecasting depth, dashboard quality, and integration capability. Whether you're managing small parcel shipping or a full multi-modal freight network, the right platform can be the difference between chasing variances and preventing them.
Key Takeaways
- Freight cost forecasting tools predict future spend using historical data, market rate intelligence, and scenario modeling — going well beyond basic invoice tracking
- Top platforms combine real-time rate benchmarking, carrier-level analytics, budget-to-actual dashboards, and multi-mode visibility in one place
- Tool selection depends on mode mix (parcel vs. LTL/FTL/ocean), shipper size, and whether the priority is operational control or strategic contract negotiation
- Top tools reviewed: MercuryGate TMS, Freightos, Oracle OTM, Transporeon, and Shipware
- Businesses pairing the right technology with expert freight spend analysis typically secure 15–40% in carrier cost reductions
Why Freight Cost Forecasting Tools Matter in 2026
Freight cost forecasting is the practice of predicting future transportation spend across modes, lanes, and carriers — using historical shipment data, market rate intelligence, and scenario modeling to build forward-looking budgets. It's distinct from invoice auditing (which is retrospective) and basic cost tracking (which is descriptive). Forecasting is proactive: it answers "what will we spend, and under what conditions?"
That distinction matters more now than it did even two years ago — before tariff-driven lane volatility and post-pandemic rate swings made next-quarter budgets nearly impossible to defend on a spreadsheet alone.
The global TMS market is projected to grow from $18.50B in 2025 to $37.04B by 2030 — a 14.9% CAGR — driven largely by shippers recognizing that manual tracking can't keep pace with modern freight complexity. The cost pressures feeding that growth are well-documented:
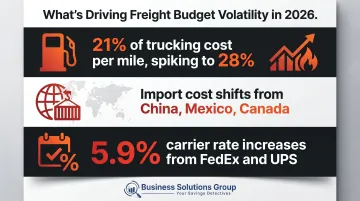
- Fuel volatility: Fuel represented roughly 21% of trucking cost per mile in 2024, spiking above 28% during surges
- Tariff exposure: Import costs from China, Mexico, and Canada shifted significantly under 2024–2025 tariff changes
- Annual GRIs: Major parcel carriers issue general rate increases each year, compounding multi-lane budget gaps
Each of these variables is forecastable — but only with purpose-built tools that go beyond static rate tables.
The tools reviewed below were selected based on their ability to deliver financial clarity across the full shipping lifecycle — from rate modeling to carrier-level spend reporting.
Best Tools for Freight Cost Forecasting & Reporting in 2026
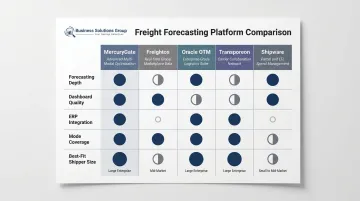
These five platforms were evaluated on forecasting capability depth, reporting and dashboard quality, ERP/WMS/carrier integration, and suitability across shipper sizes and freight modes.
MercuryGate TMS
MercuryGate is a cloud-based TMS built for mid-market and enterprise shippers managing multi-modal freight across parcel, LTL, FTL, ocean, air, intermodal, and rail. Its rate management engine supports carrier contract modeling and lane-level cost forecasting, while its MercuryMaestro dashboard suite enables budget variance analysis and spend reporting across freight categories.
What sets it apart for forecasting: MercuryGate automatically updates fuel and accessorial charges within contracted rate structures. Its what-if network optimization lets shippers model how a base rate increase on a key lane or a fuel spike affects total spend before it happens.
| Feature Category | Details |
|---|---|
| Key Forecasting Features | Multi-modal rate management, lane-level cost modeling, carrier contract scenario analysis, what-if optimization, budget variance dashboards, accrual monitoring |
| Best For | Mid-market to enterprise shippers managing complex, multi-modal carrier networks |
| Pricing Model | Quote-based / enterprise licensing (not publicly disclosed) |
Freightos
Freightos is a digital freight marketplace and rate intelligence platform that aggregates real-time ocean, air, and trucking rates from hundreds of carriers and forwarders. Its Terminal product allows shippers to upload contracted rates and benchmark them directly against live market data — filtering by lane, surcharge type (BAF, PSS, GRI), and historical trends.
For freight budget forecasting, Freightos is particularly useful for stress-testing assumptions. One public testimonial on the platform references avoiding millions in unnecessary surcharges by accessing fresh market data rather than relying on contracted rates alone.
| Feature Category | Details |
|---|---|
| Key Forecasting Features | Real-time rate aggregation, lane-by-lane market benchmarking, contracted vs. spot rate comparison, surcharge drill-down, procurement scenario modeling |
| Best For | SMBs and mid-market importers/exporters needing fast rate intelligence across ocean and air modes |
| Pricing Model | Free signup with enterprise subscription tiers (enterprise pricing not publicly listed) |
Oracle Transportation Management (OTM)
Oracle Transportation Management is an enterprise-grade TMS recognized as a Gartner Magic Quadrant Leader, used by large shippers and 3PLs to manage transportation spend across complex, multi-leg supply chains globally. Its analytics capabilities include ML-based transit time prediction, carrier performance scorecards, and freight cost modeling integrated with Oracle ERP and third-party financial systems.
OTM's core forecasting strength is its depth of financial integration — it delivers cost-to-budget reporting at the shipment, lane, trade lane, and business unit level, making it the tool of choice for finance teams that need freight spend reconciled against enterprise ledgers.
| Feature Category | Details |
|---|---|
| Key Forecasting Features | End-to-end freight cost modeling, multi-leg lane analytics, ERP-integrated budget reporting, ML-based transit prediction, carrier scorecard dashboards |
| Best For | Large enterprises with global freight networks and existing Oracle ecosystem investments |
| Pricing Model | Enterprise licensing; quote-based (not publicly disclosed) |
Transporeon
Transporeon, a Trimble company, is a freight procurement and spend analytics platform serving large shippers across Europe and North America. Its Rate Benchmark module benchmarks contracted FTL road rates at ZIP/postal code granularity against market indices, while its Autonomous Quotation feature automates spot procurement — connecting benchmarking directly to carrier contract strategy.
With a network of over 1,400 shippers and 150,000+ carriers, Transporeon's recently announced platform innovations include embedded freight audit alongside procurement and benchmarking. This ties forecasting, tendering, and post-shipment validation into a single workflow — something few platforms manage end to end.
| Feature Category | Details |
|---|---|
| Key Forecasting Features | Freight tender management, ZIP-level rate benchmarking vs. market indices, spend analytics by lane/carrier/region, autonomous spot quotation, embedded freight audit |
| Best For | Large shippers and procurement teams managing complex carrier contract portfolios, particularly across Europe |
| Pricing Model | Enterprise SaaS; quote-based (not publicly disclosed) |
Shipware
Shipware is a parcel and LTL spend analytics platform purpose-built for shippers who want carrier invoice auditing, rate benchmarking, and forward-looking spend forecasting — without the complexity of a full TMS. Its 65-point automated invoice audit covers UPS, FedEx, DHL, and LTL carriers, catching issues that commonly go undetected:
- Billing errors and incorrect weight classifications
- Late delivery credits never applied
- Accessorial overcharges buried in carrier invoices
Beyond auditing, Shipware's Spend Management Portal provides real-time analytics, KPI dashboards, and scenario modeling tools that project future parcel and LTL spend under different volume and rate assumptions. Shipware's audit process recovers 1–9% of total parcel and freight spend — a significant return for shippers where accessorials and surcharges represent a growing share of total cost.
For small-to-mid-market shippers, Shipware fills a gap that TMS platforms often leave open. It delivers granular spend intelligence at the carrier and accessorial level — a focus area Business Solutions Group prioritizes in its parcel advisory work — without requiring enterprise implementation resources.
| Feature Category | Details |
|---|---|
| Key Forecasting Features | 65-point invoice audit, accessorial charge analysis, parcel and LTL spend forecasting, rate benchmarking, custom KPI dashboards |
| Best For | Small-to-mid-market parcel and LTL shippers seeking freight audit, benchmarking, and spend intelligence without full TMS complexity |
| Pricing Model | Performance-based or subscription (free audit CTA on site; pricing not publicly listed) |
Key Features to Look For in a Freight Cost Forecasting Tool
Forecasting Depth Beyond Rate Lookup
The feature that separates a forecasting platform from a rate quoting tool is multi-scenario cost modeling. The best tools let teams run questions like: "What happens to total freight spend if fuel surcharges rise 15%, or if our primary LTL carrier raises base rates on our three highest-volume lanes?" That kind of modeling allows finance teams to build contingency budgets, not just point-in-time estimates.
Dashboard Quality and Spend Visibility
Effective dashboards surface spend by carrier, lane, mode, and time period and let teams compare budget versus actual freight costs without manual reconciliation. Gartner's 2025 Critical Capabilities for TMS specifically identifies Analytics and User Experience as key differentiators across all complexity levels.
Look for platforms that offer:
- Export formatted reports for finance and executive review
- Support configurable views by cost center, lane, or time horizon
- Enable budget-vs-actual comparison without manual reconciliation
ERP, WMS, and Accounting Integration
A forecasting tool that can't connect to the financial systems where freight costs are ultimately recorded loses most of its value. Prioritize platforms with native ERP integrations or open APIs that allow bidirectional data flow. Manual exports break the data chain and introduce reconciliation errors. Business Solutions Group's TMS advisory work consistently identifies integration gaps as the primary reason freight spend data fails to reach the teams who need it for budget planning.
Carrier Benchmarking and Market Rate Intelligence
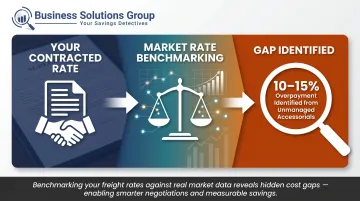
Knowing your contracted rate means little without knowing whether it's competitive. Tools that include lane-level benchmarking against market indices allow shippers to validate existing contracts, identify negotiation leverage, and improve budget accuracy. Internal research at Business Solutions Group shows that many companies are paying 10–15% more than necessary due to unmanaged accessorials alone — a gap that benchmarking surfaces immediately.
Mode Coverage and Scalability
Assess whether a platform covers your full freight mix and can scale as volumes grow. A parcel-only tool creates blind spots for shippers who also manage LTL or ocean freight. Key questions to ask before committing:
- Does it cover all modes you currently ship (parcel, LTL, FTL, ocean, air)?
- Can it scale with volume growth without a platform change?
- Is it right-sized for your operation, or will you pay for enterprise features you'll never use?
How Business Solutions Group Approaches Tool Selection
The tools above were evaluated using criteria consistent with Business Solutions Group's benchmark analysis methodology: forecasting methodology (scenario modeling vs. simple rate lookup), reporting depth, real-world usability for freight and logistics teams, and ability to serve both small parcel shippers and complex freight operations.
Key differentiating factors assessed across all five tools:
- Integration breadth — native connectors vs. custom API requirements for ERP/WMS/accounting systems
- Data update frequency — real-time vs. batch processing and its impact on budget accuracy
- Geographic and modal coverage — whether the platform matches the shipper's actual freight footprint
- Pricing transparency — whether pricing is accessible or requires a lengthy sales cycle to evaluate
- Out-of-box reporting quality — what's available without custom configuration vs. what requires professional services
Even with strong criteria in place, shippers consistently stumble at the same point: selecting based on UI alone, without verifying whether the platform delivers real cost intelligence at the carrier and lane level.
The better question isn't "which tool looks the best?" — it's which platform gives your team the visibility to act on cost drivers before they hit the P&L. That answer looks different depending on your mode mix, shipment volume, and whether you're focused on day-to-day cost control or annual budget planning.
Conclusion
The right freight forecasting tool depends entirely on your operation. A small parcel shipper overpaying on accessorials needs different capabilities than a global enterprise modeling multi-leg supply chain costs against Oracle ERP budgets.
Before selecting a platform, evaluate it against three concrete criteria:
- Does it deliver lane-level cost forecasts, not just current rate lookups?
- Does it support budget-to-actual variance analysis with exportable reports?
- Does it integrate with the financial systems your finance team already uses?
Knowing what to look for is step one — but benchmarking your current spend against the market often reveals the biggest gaps. Business Solutions Group works with freight and parcel shippers to audit freight spend, negotiate carrier contracts, and identify the right technology stack for cost forecasting and reporting. The process runs at no upfront cost, and the benchmark analysis alone typically surfaces 10–30% in savings opportunities. Reach out for a consultation to see how your freight costs compare.
Frequently Asked Questions
Frequently Asked Questions
What is the best tool for freight cost forecasting?
The right tool depends on freight mode, shipper size, and your primary goal. TMS platforms like MercuryGate and Oracle OTM suit complex multi-modal networks, while Freightos and Shipware serve SMBs needing rate intelligence and parcel spend analytics without enterprise-level implementation overhead.
What tool is best used for dashboard data insights and reporting?
Transporteon leads for procurement-linked spend reporting, while Shipware's Spend Management Portal excels for parcel and LTL analytics. The best dashboards surface spend by carrier, lane, and mode in real time, giving finance and logistics teams budget-versus-actual visibility without manual data pulls.
What is a KPI dashboard for supply chain?
A supply chain KPI dashboard is a centralized visual interface tracking metrics like freight cost per unit, on-time delivery rate, carrier compliance, and budget variance. In freight cost forecasting, it allows teams to monitor spend trends and flag deviations before they erode margins.
What are the 4 types of dashboards?
The four types are operational (real-time monitoring), analytical (trend and pattern analysis), strategic (executive-level KPIs), and tactical (short-horizon decision support). Most freight forecasting tools blend operational and analytical views, with strategic dashboards reserved for enterprise-tier platforms.
What is an overhead cost dashboard in freight?
An overhead cost dashboard tracks indirect logistics costs: carrier surcharges, accessorial fees, warehousing overhead, and administrative freight charges. In freight reporting, it surfaces cost categories that standard shipment-level reporting misses, where unbudgeted spend typically accumulates.
What is the 5-second rule for dashboards?
The 5-second rule holds that a well-designed dashboard should communicate its most critical insights within five seconds of viewing. In freight cost reporting, that means carrier spend variance, budget-to-actual gaps, and lane-level cost flags should be front and center, not buried in dense data tables.