Introduction
U.S. business logistics costs reached $2.58 trillion in 2024, equal to 8.8% of GDP — well above the pre-pandemic range of 7.4% to 7.8%. For individual organizations, that macro figure translates directly into compressed margins, tighter operating budgets, and reduced flexibility on delivery pricing.
Transportation spend is difficult to manage because the base freight rate is only part of the problem. Billing errors go unchallenged, carrier contracts drift above market, mode decisions get made out of habit rather than analysis, and spend data sits scattered across systems that were never designed to talk to each other.
This article addresses transportation cost reduction across three distinct layers: the decisions made before freight moves, the controls applied while managing active spend, and the structural conditions that shape why freight moves in the first place. Each layer contains meaningful savings — and organizations that address all three consistently outperform those that focus on rate negotiation alone.
Key Takeaways
- Transportation spend management tracks and optimizes freight and parcel costs — eliminating waste without sacrificing service levels
- Costs hide in billing errors, contract drift, poor mode selection, and fragmented data — rarely appearing as one visible line item
- The biggest cost drivers are carrier contract gaps, limited spend visibility, operational inefficiencies, and market volatility
- Cost reduction works at three levels: pre-shipment decisions, active spend controls, and upstream operational conditions
- Companies combining spend intelligence, freight auditing, and strategic carrier relationships outperform those relying on rate shopping alone
How Transportation Costs Typically Build Up
Transportation spend doesn't spike overnight. It builds in layers — small enough to overlook individually, significant enough to erode margins by quarter-end.
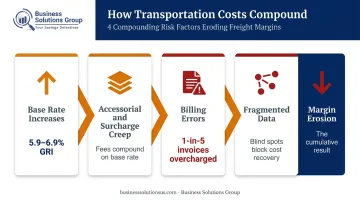
Four compounding factors drive most of the damage:
- Base rate increases compound annually. FedEx implemented a 5.9% general rate increase for packages and 6.9% for freight effective January 2026, while surcharges rose 13% from Q3 to Q4 of the same period.
- Accessorial and surcharge creep adds charges for residential delivery, dimensional weight overages, address corrections, and fuel adjustments that often outpace base rate growth.
- Billing errors go undetected without systematic auditing — Business Solutions Group's internal research found that 1 in 5 shipping invoices contains overcharges.
- Fragmented data hides the full picture. Spend tracked across disconnected carrier portals, spreadsheets, and ERP exports rarely surfaces patterns until a budget review forces the issue.
The Base Rate vs. Accessorial Gap
Most shippers focus on negotiating base rates while accessorial charges accumulate. These include:
- Fuel surcharges (which can move independently of actual diesel prices)
- Dimensional weight penalties when packaging is oversized relative to product
- Residential and delivery area surcharges
- Service failure costs and expedited recovery shipments
Securing a discount on the base rate doesn't guarantee total cost stability. With surcharge structures expanding year over year, reducing one line item often just shifts where the growth appears.
Key Cost Drivers in Transportation Spend
Four drivers consistently account for the majority of avoidable transportation spend — and each one responds to deliberate management.
Carrier Contract Structures
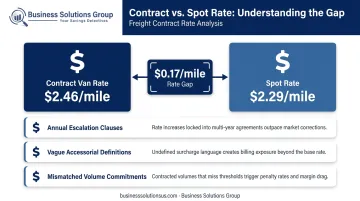
Carrier agreements function as a cost floor that everything else builds on. Contract terms left unreviewed typically work in the carrier's favor through three common mechanisms:
- Annual escalation clauses that embed rate increases automatically
- Vague accessorial definitions that create billing gray areas carriers interpret to their advantage
- Minimum volume commitments that lock shippers into pricing tiers no longer matching their actual shipping profile
DAT data shows December 2025 contract van rates at $2.46/mile against spot rates of $2.29/mile — a meaningful gap for shippers renewing contracts without current market context. Without benchmark data, most organizations don't know whether their negotiated rates are competitive or simply the rates their carrier preferred to offer.
Fragmented Data and Limited Visibility
When transportation spend is managed across multiple carrier portals, disconnected invoices, and manual spreadsheets, pattern recognition becomes nearly impossible. Mode comparisons, lane-level cost analysis, and carrier performance evaluation all require a unified data foundation.
Without that foundation, decisions default to convenience: the carrier already in use, the mode already approved, the service level already assumed to be necessary.
Operational Inefficiencies
These are decision-driven cost amplifiers, not fixed costs:
- Choosing expedited freight when standard delivery meets the actual customer requirement
- Shipping under-consolidated loads when consolidation was feasible
- Defaulting to premium modes due to poor demand planning rather than genuine urgency
Each of these decisions adds cost at the transaction level and, at volume, represents a large share of avoidable spend.
External Market Volatility
Fuel costs, carrier capacity cycles, and regulatory shifts impose real pressure. EIA data shows U.S. No. 2 diesel at $5.596/gallon in May 2026, up $2.06 per gallon year-over-year. Companies with diversified carrier relationships and well-structured contracts absorb these swings more effectively than those with single-carrier dependencies and passive contract terms.
Cost-Reduction Strategies for Transportation Spend
Effective transportation spend management operates across three distinct layers simultaneously. Addressing only one produces limited, temporary results.
Strategies That Change Decisions Before Freight Moves
These approaches reduce cost by improving the quality of decisions made before a shipment leaves the dock.
Use benchmark analysis to renegotiate carrier contracts. Business Solutions Group's benchmark analysis compares client rates against market pricing across all modes — parcel, LTL, FTL, air, ocean, and rail — to one-tenth of a percent. Most clients discover 10–30% in actionable savings before renegotiation even begins.
Define service requirements precisely before selecting carriers or modes. Using expedited service when standard delivery meets the actual customer requirement inflates costs from the first shipment. Aligning mode and service tier to real delivery windows — not assumed urgency — removes that cost permanently.
Consolidate carrier relationships to build volume leverage. Spreading volume across too many carriers dilutes negotiating leverage. A rationalized carrier base with clear performance tiers improves pricing outcomes and accountability throughout the contract period.
Evaluate mode mix based on total landed cost, not rate cards alone. Per-shipment rate quotes ignore dimensional weight exposure, transit-time inventory carrying costs, and accessorial patterns. A total-cost lens routinely changes mode selection on high-frequency lanes.
Strategies That Change How Transportation Is Managed
Once freight is moving, cost control depends on visibility, compliance, and rapid response to billing and performance exceptions.
Implement systematic freight auditing to recover billing errors. Carrier invoices routinely contain overcharges, duplicate billing, incorrect accessorials, and missed service credits. According to nVision Global, audits recover up to 8% of total freight spend — and most Business Solutions Group clients see recoveries within the first billing cycle.
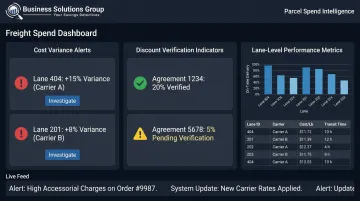
Deploy real-time spend dashboards to monitor actuals against budget. Monthly cost reports identify problems after the overspend has already occurred. Business Solutions Group's Parcel Spend Intelligence platform surfaces 40+ insights — cost variance alerts, discount verification, lane-level performance — so teams can intervene before exceptions compound.
Enforce routing guide compliance across internal teams and business units. Negotiated rates only deliver savings when followed. Unauthorized carrier selections and off-guide shipments introduce rate inconsistencies and undermine the volume commitments that support contract pricing.
Track carrier performance against contract terms continuously. Late pickups, missed delivery windows, and capacity failures each trigger downstream costs: expedited recovery shipments, inventory carrying charges, and customer service failures. None of these become visible without ongoing performance tracking against contract terms.
Strategies That Change the Context Around Transportation
The most durable savings come from fixing the upstream operational conditions that determine why and how freight moves.
Align shipping frequency with demand patterns to reduce unplanned expedited spend. Most expedited shipments trace back to poor demand planning, late purchase orders, or disconnected inventory systems — not transportation failures. Aligning fulfillment triggers to actual demand cycles eliminates the reactive shipping pattern driving premium spend.
Optimize packaging dimensions to reduce dimensional weight charges. Parcel and freight carriers charge on package volume when the volume-to-weight ratio is unfavorable. Packaging oversized relative to product dimensions inflates billable weight on every shipment — redesigning dimensions delivers recurring savings across every lane without touching service levels.
Consolidate shipments to eliminate underloaded or fragmented freight movements. Splitting orders or shipping partial loads when consolidation was feasible is a recurring cost pattern. Building consolidation discipline into order management workflows reduces cost per unit shipped and improves carrier utilization.
Diversify the carrier base strategically to reduce market exposure. Single-carrier dependence creates pricing vulnerability during peak seasons, capacity crunches, and renewal cycles. A diversified portfolio — with clear primary and secondary assignments by lane — provides competitive alternatives and limits the leverage any one provider holds.
Conclusion
Transportation spend doesn't become excessive because freight is inherently uncontrollable. It becomes expensive when visibility into cost origins is limited, contract terms are accepted without market context, and spend is managed reactively rather than through structured oversight.
The savings don't come from a single negotiation or a one-time audit. They come from compounding improvements: better decisions, tighter controls, and consistent market context applied over time.
The companies that consistently achieve lower freight costs treat spend intelligence, carrier relationships, and operational discipline as ongoing programs. Business Solutions Group works with parcel and freight shippers to identify where costs originate, benchmark rates against current market conditions, and implement the controls required to sustain savings over time. The engagement starts with a no-cost, no-commitment analysis, typically completed within 3–5 business days, that reveals the full scope of savings available before any agreement is required.
Frequently Asked Questions
What is most often the lowest cost transportation mode?
Ground shipping and LTL (less-than-truckload) freight are generally the lowest-cost options for domestic shipments, but the answer depends on shipment weight, distance, urgency, and package dimensions. Total landed cost — not just the per-shipment rate — should guide mode selection on high-frequency lanes.
What is transportation spend management?
Transportation spend management is the systematic process of tracking, analyzing, and optimizing all freight and parcel costs across carriers, modes, and lanes. The goal is to reduce avoidable spend while maintaining the service performance that operations and customers require.
What are the most common hidden costs in transportation spending?
The most common hidden costs are accessorial charges, dimensional weight penalties, billing errors on carrier invoices, annual rate escalation clauses embedded in contracts, and inventory carrying costs created by unreliable carrier performance. Without systematic auditing, each category goes undetected and compounds over time.
How does freight auditing help reduce transportation costs?
Freight auditing reviews carrier invoices against contracted rates and service level agreements to identify overcharges, duplicate billing, and unwarranted surcharges. Left undetected, these errors add up fast — nVision Global estimates audits can recover up to 8% of total freight spend.
How can a company tell if its carrier contracts are costing too much?
Benchmark analysis — comparing current contract rates against prevailing market rates for similar lanes, volumes, and modes — is the most direct method. Without external market data, there's no reliable way to know whether negotiated rates are actually competitive.
What is the difference between a TMS and transportation spend management?
A TMS (transportation management system) is software for planning, executing, and tracking shipments. Transportation spend management is a broader discipline that includes auditing, contract optimization, benchmark analysis, and spend intelligence. A TMS supports spend management but doesn't replace the strategic advisory work needed to sustain meaningful cost reduction over time.