Introduction
Transportation costs typically run 3% to 7% of company revenues, according to RateLinx — and for businesses operating complex freight networks, a meaningful slice of that spend is recoverable. According to nVision Global, 20% of freight invoices contain errors, with ocean freight invoice error rates reaching 30%. Separately, billing errors and overcharges account for 3% to 5% of total shipping bills.
That leakage doesn't announce itself. It compounds across lanes, modes, and carrier relationships — each billing error or unaudited contract quietly eroding margins that looked stable on last quarter's report.
The CSCMP's 2025 State of Logistics Report puts U.S. business logistics costs at $2.3 trillion, or 8.7% of GDP. At that scale, even fractional inefficiencies represent real dollars. For complex shippers, the core problem is controllable: fragmented decisions, poor visibility, and the absence of structured oversight let avoidable costs accumulate without anyone flagging them.
This article examines how those costs build up, what drives them, and which strategies have the most impact.
Key Takeaways
- Freight costs in complex networks accumulate through layered inefficiencies, rarely from a single visible source
- Mode selection, service levels, and contract terms drive more cost than carrier rates alone
- 20% of freight invoices contain errors — proactive auditing recovers dollars that would otherwise disappear into operating costs
- Carrier benchmarking, freight consolidation, and centralized data visibility are the highest-leverage strategies for complex shippers
- One-time audits don't sustain savings; ongoing optimization is what separates shippers who control freight spend from those who consistently overpay
How Freight Costs Build Up in Complex Networks
Cost accumulation in complex freight networks is gradual and compounding. Small per-shipment inefficiencies — accessorial fees, mode mismatches, idle capacity — multiply across hundreds or thousands of lanes until they represent a significant share of total transportation spend.
Most of these costs stay hidden until a variance shows up. They surface through invoice discrepancies, contract drift, service level mismatches, and carrier agreements that go unreviewed through annual cycles. By the time a budget variance surfaces, those causes have often been accumulating for six months or more.
Complexity amplifies this problem. The more carriers, modes, geographies, and distribution points in a network, the harder it becomes to maintain consistent pricing discipline.
The Food Shippers of America has documented how transportation network drift — the gradual misalignment between actual shipping patterns and contracted assumptions — can generate $600K to $1M+ in excess cost on $100M in truckload spend.
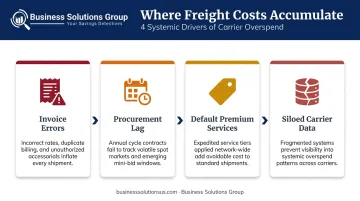
A few mechanisms drive most of this accumulation:
- Incorrect rates, duplicate billing, and unauthorized accessorial charges repeating across high-volume lanes
- Annual procurement cycles that lag behind volatile market conditions — the JOC reports shippers increasingly turning to short-term mini-bids as a result
- Premium and expedited service options applied as network-wide defaults rather than exceptions
- Carrier data siloed across systems, making systemic overspend impossible to detect
None of these factors is catastrophic in isolation. Together, they turn manageable freight spend into chronic overspending — often without triggering any single alarm.
Key Cost Drivers for Complex Freight Networks
Understanding where cost originates matters as much as knowing how much you're spending. In complex networks, drivers fall into three categories: early decisions, ongoing conditions, and structural factors.
Decisions Made at Procurement and Contracting
These have the longest-lasting cost impact. Locking into unfavorable contract terms, over-specifying service levels, or failing to consolidate volume across business units embeds structural overspend that compounds through the entire contract period.
Mode selection is a concrete example. BTS data shows average freight revenue per ton-mile of 168.1 cents for air, 21.1 cents for truck, 4.78 cents for rail, and 1.91 cents for water. Defaulting to premium modes for shipments that qualify for lower-cost alternatives creates a structural cost premium that rate negotiation alone won't solve.
Ongoing Conditions: Rates, Fuel, and Accessorials
The Cass Transportation Index for April 2026 reported shipments down 4.4% year over year while expenditures were up 3.5% — with the Truckload Linehaul Index rising 5.6% YoY. Volume assumptions don't predict rate behavior, which is why these conditions require continuous monitoring rather than periodic attention.
Fuel adds another layer of volatility. The EIA reported national on-highway diesel at $5.210/gallon as of June 2026, up $1.739 year over year. Regional variation is substantial: California averaged $6.94/gallon versus $4.79 on the Gulf Coast. That spread directly affects landed cost by lane — and is precisely why fuel surcharge logic warrants its own negotiation track, separate from base-rate discussions.
Structural Factors: Network Design
These factors set the conditions in which everything else operates — and they're less visible than invoice errors, which is what makes them expensive to ignore. The three most consequential:
- Distribution center placement relative to customer density determines base transit costs before any carrier negotiation begins
- Carrier agreement structure — including minimum volume commitments, service tiers, and incentive thresholds — shapes what rates are actually achievable
- Volume allocation across the carrier base affects leverage, redundancy, and the ability to shift freight in response to capacity or rate changes
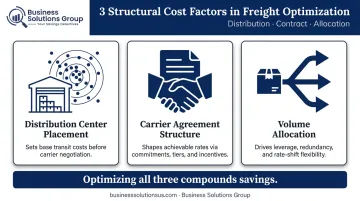
Optimizing any one of these can reduce freight spend. Optimizing all three compounds the savings.
Cost-Reduction Strategies for Freight in Complex Networks
The most effective approach addresses three dimensions: how the network was designed, how it is currently managed, and the broader operational context around it. Rate renegotiation alone addresses only a fraction of the opportunity.
Strategies That Target Procurement Decisions
These change the cost floor before freight moves.
Consolidate volume across business units and geographies. Fragmented shipping eliminates the volume leverage that unlocks carrier discounts. Consolidating shipments — combining orders, aligning supplier pickup schedules, or pooling volume across facilities — increases load density and creates negotiating leverage that siloed shipping can't achieve.
Right-size mode to actual service requirements. Given the freight revenue per ton-mile gap between air (168.1 cents) and truck (21.1 cents), even partial mode conversion on qualifying lanes produces meaningful savings. The question to ask for each lane: does the service requirement actually justify this mode, or is it a default?
Stop over-specifying service levels. Premium commitments — guaranteed overnight, white-glove handling, guaranteed transit times — add cost disproportionate to their necessity when applied as defaults rather than exceptions. Calibrating service specifications to actual customer or operational requirements is a structural lever — one that compounds across every lane in the network.
Select carriers based on lane specialization, not incumbency. Carriers with dense coverage on specific lanes typically offer better rates and higher reliability than generalist carriers applied uniformly across a network. Carrier bids are network-dependent: lane fit and coverage density directly affect both price and reliability, which is why incumbent carriers rarely win on every lane when alternatives are properly evaluated.
Strategies That Target Freight Management
These reduce the cost of inaction and the cost of errors across an active network.
Centralize freight data. Without a single repository aggregating carrier, mode, and lane data, optimization decisions rest on incomplete information. Fragmented data prevents shippers from identifying systemic overspend, comparing lane-level performance, or detecting invoice anomalies at scale.
Every other management strategy in this section depends on having this visibility in place first.
Audit invoices proactively and consistently. Freight audit isn't a one-time recovery project — it's a recurring control. nVision Global reports that effective freight bill auditing can recover as much as 8% of total freight spend by identifying incorrect rates, duplicate billing, inaccurate classification, and invalid accessorial charges. Periodic spot checks don't capture this — only a structured process applied consistently at the invoice level does.
Manage carrier contracts actively. Rates, accessorial schedules, and service commitments drift out of alignment with market conditions between renewal cycles. Shippers who monitor contract performance and trigger renegotiations when benchmarks shift recapture value that passive shippers forfeit. Business Solutions Group's benchmark analysis and proprietary spend intelligence software give shippers the carrier rate intelligence to negotiate from a data-backed position — rather than relying on the carrier's framing of what rates are appropriate.
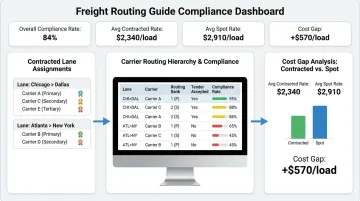
Enforce routing guide compliance. When individual facilities or business units make independent carrier decisions outside negotiated agreements, the network loses the consolidated volume leverage those agreements were built on. DAT's research confirms that routing guide deviations force shippers into the spot market at premium rates — the gap between contracted and spot rates is where compliance failures become budget misses.
Strategies That Target Network Context
These address structural factors that set the conditions for all other cost decisions.
Diversify the carrier base. Concentration in one or two carriers removes competitive tension from negotiations and leaves the network exposed when those carriers reprice or face capacity constraints. Maintaining a vetted set of alternatives for each key lane creates leverage in negotiations and continuity options when primary carriers fail.
Reassess distribution node placement. A peer-reviewed NECSI study published in Complexity (2020) found that optimizing both shipment strategy and warehouse placement — shifting decisions between direct and indirect shipping routes — can forecast 10.5% annual transportation cost savings, with an additional 4.6% from establishing three new warehouse locations. This isn't about adding infrastructure; it's about positioning nodes relative to customer density so lane distances and shipment modes align with actual demand patterns.
Build disruption resilience into the network. Shippers who plan for capacity crunches, carrier failures, and geopolitical disruptions absorb those events without emergency routing costs. Those who react without a plan routinely overpay for last-minute solutions. Scenario planning converts a reactive cost into a managed one — the difference shows up in freight spend variances across quarters.
Use eProcurement to remove incumbency bias. Without structured eProcurement, incumbent carriers retain leverage that inflates costs over time — not because their rates are competitive, but because alternatives aren't systematically evaluated. Introducing market-rate alternatives at each decision point resets the negotiating baseline.
Business Solutions Group's eProcurement solutions cover all major freight modes — LTL, truckload, ocean, air, and rail — making it possible to apply this discipline across a full multi-modal network.
Conclusion
Reducing freight costs in complex networks requires knowing where cost originates — whether in procurement decisions, operational management failures, or network design — and applying the right lever at the right point. Rate negotiation addresses one lever. Invoice auditing addresses another. Neither alone is sufficient.
The shippers who consistently control freight spend treat optimization as an ongoing practice: continuous monitoring, proactive auditing, regular benchmarking, and disciplined procurement at every contract cycle. That discipline is what separates managed freight spend from systemic overspending.
For businesses ready to move from reactive freight management to structured cost control, Business Solutions Group offers benchmark analysis, spend intelligence software, contract negotiation, and eProcurement solutions — each designed to give freight spend a clear owner, a measurable baseline, and a path to sustained reduction. The starting point is understanding what your current spend actually reflects. That's where the work begins.
Frequently Asked Questions
What is freight cost optimization?
Freight cost optimization is the systematic process of identifying and reducing unnecessary or controllable costs across a transportation network — covering carrier contracts, mode selection, route efficiency, and invoice accuracy — without sacrificing service quality. It spans both one-time corrective actions and ongoing monitoring disciplines.
What are the five types of network optimization problems?
The five common types include routing (finding efficient paths), facility location (optimal node placement), flow optimization (maximizing throughput within capacity constraints), carrier and mode selection, and cost allocation. Complex freight networks typically face several simultaneously, requiring an integrated approach.
What causes freight costs to spike in complex logistics networks?
Cost spikes typically result from a combination of factors: carrier rate increases at contract renewal, accumulating accessorial charges, invoice billing errors, mode mismatches, and loss of consolidated volume leverage when shipment decisions are made in silos across business units.
How does carrier contract benchmarking help reduce freight spend?
Benchmarking compares a shipper's contracted rates against current market rates for the same lanes and service types, revealing where overpayment exists. That evidence supports improved terms at renewal — or mid-cycle renegotiations when market conditions shift significantly.
What is the difference between freight consolidation and freight network optimization?
Freight consolidation is a specific tactic — combining shipments to reduce frequency and increase load density. Freight network optimization is the broader strategic process of restructuring carriers, lanes, modes, distribution points, and contracts to minimize total cost across the entire network.
How often should a business review its freight network for cost savings opportunities?
Formal network reviews should happen at least annually, with continuous monitoring in between. Reviews should accelerate when significant carrier changes, volume shifts, or supply chain disruptions occur — annual procurement cycles alone aren't responsive enough in volatile markets.