Introduction
Most freight shippers walk into carrier contract negotiations using data the carrier prepared. That's not a negotiation — it's a review session where the carrier controls every number on the table.
Without an independent view of your own spend, lane performance, rate compliance, and market benchmarks, the default outcome is predictable: you evaluate whether the carrier's proposed rates "sound reasonable" rather than whether they're defensible by any market standard. Carriers know this, and they price accordingly.
Freight billing errors affect an estimated 15% to 25% of all invoices, and mid-market shippers lose **3% to 7% of total annual freight spend** to billing discrepancies they never catch. That's real margin eroding every contract cycle — quietly, and without dispute.
This guide covers how freight intelligence dashboards shift that balance: the metrics that matter most heading into negotiations, and how to turn your own data into defensible contract terms.
Key Takeaways
- Freight intelligence dashboards consolidate carrier spend, lane performance, rate compliance, and accessorial data into a single negotiation-ready view
- Top KPIs for contract negotiations: rate compliance variance, accessorial charge trends, on-time delivery rates, and carrier spend concentration
- Market benchmark comparisons give shippers an independent opening position instead of reacting to carrier proposals
- Carriers concede more when confronted with documented data, not vague dissatisfaction
- Business Solutions Group's proprietary spend intelligence software automates this analysis and manages over $3 billion in parcel spend
What Is a Freight Intelligence Dashboard?
Freight intelligence is the discipline of collecting, standardizing, and analyzing freight spend, carrier performance, and network data to support strategic decisions — not just day-to-day operational ones. The distinction matters.
A TMS tracks shipments executed through that system. A carrier portal shows you what that carrier wants you to see. Neither gives you a cross-network view of what you're actually paying, how that compares to market rates, or where your contract compliance is breaking down.
A freight intelligence dashboard consolidates data across all carriers, lanes, contract types, and invoice line items into visual KPIs, trend charts, and benchmarks — regardless of mode or who booked the freight.
The Execution Gap Problem
There's a well-documented disconnect in freight management called the "execution gap": contracted rates live in PDFs, rate tables get entered manually and incorrectly, and nobody systematically checks invoices against contract terms. The result is that shippers pay what carriers bill, not what contracts specify.
A freight intelligence dashboard closes this gap — and in doing so, builds the evidence repository that determines whether you walk into a contract renewal prepared or pressured.
Business Solutions Group's spend intelligence platform converts raw logistics data into consolidated dashboards surfacing over 40 distinct metrics across spend, compliance, and carrier performance. It connects to ERP systems, WMS platforms, and other data sources to eliminate the manual spreadsheet environment where negotiation leverage disappears.
Key Metrics Your Freight Intelligence Dashboard Should Track
Carrier Rate Compliance
Track contracted rate versus actual invoiced rate by carrier and lane. In practice, most shippers never do it consistently.
When carriers bill above negotiated rates, apply incorrect discount tiers, or misclassify shipment types, the financial impact compounds quietly. Research from Auditec Solutions shows recovery audits identify overcharges representing 1% to 3% of total transportation spend — funds that went to carriers rather than staying with shippers.
Two compliance tracking requirements that often get overlooked:
- Minimum charge thresholds: Carriers sometimes apply headline discounts only to shipment types or weight breaks you rarely use. The discount looks impressive on paper; in practice, minimum charges make it nearly irrelevant for your actual shipping profile
- Discount tier accuracy: Verify that volume-based discount tiers are applied correctly as your shipping patterns shift throughout the year
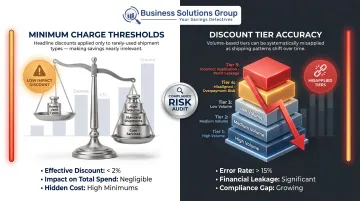
Rate compliance data recovers past overcharges and documents systematic billing behavior — both become direct evidence in renegotiation conversations.
Accessorial Charge Trends
Accessorial fees are where freight contracts erode between negotiation cycles. Detention, fuel surcharges, residential delivery, liftgate, and hazmat handling fees are assessed after shipment completion, making them difficult to forecast and easy to overlook.
The financial exposure adds up fast. According to Warp's 2026 LTL Rate Benchmarks, **accessorial charges can account for 10% to 40% of total LTL shipping costs**. Industry practitioners recommend considering contract renegotiation when accessorials reach 20% to 30% of the total freight bill.
Your dashboard should track accessorials by:
- Type (detention, fuel surcharge, liftgate, residential, TONU)
- Carrier (which carriers charge most aggressively)
- Lane (which origin-destination pairs generate the most fees)
- Frequency over time (patterns that reveal negotiation targets)
Patterns are what matter. A carrier that charges detention on 40% of your deliveries to a specific region isn't experiencing random delays: they're billing a predictable cost that can be addressed with a waiver request, cap, or pre-agreed accessorial schedule during contract negotiations.
On-Time Delivery and SLA Performance
SLA performance data is the performance side of the negotiation equation. Industry benchmarks provide useful context:
| Mode | Typical On-Time Benchmark |
|---|---|
| Full Truckload (FTL) | 90–95% |
| Contract Carriage | 95–98% |
| LTL | 70–80% |
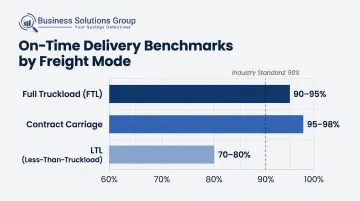
A carrier operating at 68% on-time delivery for your LTL lanes has a measurable service gap relative to industry norms. That gap weakens their justification for premium pricing and creates documented grounds for rate concessions or SLA penalties in the contract.
Track on-time pickup and delivery rates, dwell time, and detention frequency by carrier. The dashboard builds a 12-month performance record — the kind of pattern history carriers can't credibly dismiss as isolated incidents.
Spend Concentration by Carrier
How your total freight volume distributes across carriers reveals two distinct negotiation levers:
- Concentration creates commitment leverage. Routing additional volume to a primary carrier increases their share of wallet — and that commitment unlocks better base rates and reduced accessorial schedules
- Diversification creates competitive tension. Spreading volume across multiple carriers gives you the credible option to shift business, which motivates carriers to compete rather than hold the line on pricing
Without spend concentration data, neither strategy can be executed with precision. The dashboard puts specific volume numbers behind commitments that would otherwise remain vague promises during negotiations.
Market Rate Benchmarks
Benchmark visibility is the most direct negotiation data point available. If your contracted rate for a lane sits materially above the market benchmark for comparable shipments and volumes, that gap becomes your opening position in the negotiation — not the carrier's proposal.
Benchmark platforms like DAT iQ source rate data from hundreds of billions in annual market transactions, providing lane-level intelligence for both spot and contract markets. The Cass Truckload Linehaul Index tracks per-mile rate changes excluding fuel and accessorials, giving shippers a clean view of underlying rate trends.
One critical discipline: ensure benchmarks are apples-to-apples. Same shipment type, same zone, same weight break, same volume tier. A benchmark comparison that mixes shipment profiles will collapse under carrier scrutiny.
Business Solutions Group conducts a complimentary benchmark analysis that compares client LTL, FTL, and parcel rates against proprietary market-rate intelligence, identifying the specific lanes and carriers where overpayment is most significant before negotiations begin.
How to Use Dashboard Data to Win Carrier Contract Negotiations
Build a Pre-Negotiation Data Package
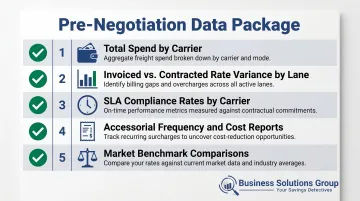
Twelve months of dashboard data should be compiled into a structured negotiation brief before any carrier conversation starts. This package should include:
- Total spend by carrier (12-month trailing)
- Invoiced vs. contracted rate variance by lane
- SLA compliance rates by carrier
- Accessorial frequency and cost reports by type and carrier
- Market benchmark comparisons for your highest-volume lanes
This document changes the dynamic. The carrier walks in expecting to present their proposal. You open with yours — and they can't dismiss it because it came from their own invoices.
Negotiate Accessorial Waivers or Caps with Evidence
General complaints about accessorial charges rarely move carriers. Documented frequency and cost data does.
If a carrier has charged detention fees on 35% of your deliveries over 12 months — totaling $47,000 — that's a negotiation target, not a footnote. Enter the conversation with specifics: dates, lanes, amounts, frequency. Request a waiver, a cap, or a pre-agreed rate schedule as a contract condition.
Carriers concede on accessorials when the evidence is specific. Vague complaints don't move the needle; documented costs do.
Use Carrier Performance Scores as Bargaining Chips
Late delivery records, damage claim rates, and SLA miss frequencies create documented grounds for rate concessions. A carrier with measurable service gaps has less justification for premium pricing — the math speaks for itself.
Performance data also shifts the conversation from price to value. Consider what this looks like in practice:
- On-time rate of 72% vs. industry benchmark of 90%: immediate grounds for a rate reduction request
- Damage claim rate above 2%: basis for liability clause renegotiation
- SLA miss frequency over 15%: leverage for service credits or contract penalties
When you put those numbers in front of a carrier, the rate discussion follows naturally.
Execute the Volume Consolidation Play
Show the carrier, with hard numbers, what routing additional volume to them means in dollar terms and shipment count. A carrier handling 30% of your freight that sees a credible path to 50% will negotiate base rates and accessorial schedules differently than one defending the status quo.
Spend concentration data from the dashboard makes this conversation specific. That specificity is what turns a general offer into a binding concession.
Lead with Benchmark Data, Not Carrier Proposals
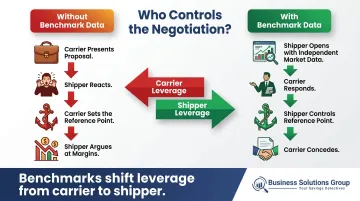
Entering a negotiation with independent market benchmark data shifts the conversation entirely. Rather than responding to a carrier's proposed rate, you open with data showing what comparable shippers pay on similar lanes.
Carriers expect shippers to react. When shippers lead with benchmarks, the carrier is the one responding. That reversal is where your leverage sits.
Common Mistakes Freight Shippers Make Without Intelligence Data
Negotiating from the carrier's proposal. This is the most common and costly mistake. Without independent spend and benchmark data, shippers evaluate whether a rate "sounds reasonable" rather than whether it's defensible. The carrier sets the reference point, and the shipper argues at the margins.
Missing accessorial inflation between contract cycles. Accessorial charges accumulate between annual renegotiations. Only approximately 35% of shippers outsource freight auditing to specialists — the rest rely on in-house spot checks that rarely catch systematic accessorial overcharges until they audit manually, if they ever do.
Meanwhile, logistics professionals spend approximately 14 hours per week manually tracking and reconciling freight data that a dashboard would surface automatically.
Auto-renewing at stale rates. Freight contracts often roll over silently at existing rates unless actively managed. Industry practitioners recommend renegotiating every 12 to 18 months to keep rates aligned with market conditions. One analysis estimates that shippers who allow silent renewals without market review risk overpaying 10% to 15% compared to actively benchmarked rates.
According to ICC Logistics, an electronics manufacturer achieved a 12% reduction in annual freight spend through data-driven renegotiation — savings that sat uncaptured through multiple auto-renewal cycles.
Shippers utilizing transportation spend analytics can identify savings of 5% to 15% on total freight spend. Every contract cycle without benchmarked data is another cycle of overpaying at rates a carrier — not the market — defined.
How Business Solutions Group Turns Dashboard Data Into Negotiation Results
Business Solutions Group's proprietary spend intelligence software consolidates freight spend data — carrier invoices, contracts, lane performance, and accessorial charges — into a single centralized dashboard. The platform manages over $3 billion in parcel spend and has helped clients achieve more than $350 million in annual savings, with LTL contract negotiations delivering 20% to 25% cost savings on average.
The platform's benchmark analysis capability compares contracted rates against market rates automatically, identifying the specific lanes and carriers where overpayment is most significant. Rather than spreading negotiation effort evenly, clients focus where savings potential is greatest — a precision that generic spreadsheet analysis can't match. The system can define optimal rate structures down to one-tenth of a percent.
Benchmark data identifies the opportunity — but converting it into carrier concessions requires a different skill set. Business Solutions Group's advisory team includes former UPS and FedEx senior-level pricing analysts who understand how carriers structure agreements and where they have room to move. The data surfaces the gaps; the advisors use that leverage to build and execute a negotiation strategy that carriers take seriously.
Key capabilities clients use throughout the negotiation process:
- Lane-level overpayment analysis pinpoints where to push hardest
- Market rate benchmarking provides third-party credibility at the table
- Carrier pricing expertise from analysts who've sat on the other side of these negotiations
- Rate optimization modeling accurate to one-tenth of a percent
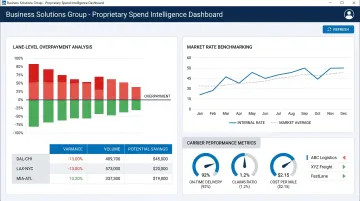
The initial benchmark analysis is complimentary and typically complete within one week — giving prospective clients a clear view of their overpayment exposure before any commitment.
Frequently Asked Questions
What is freight intelligence?
Freight intelligence is the practice of collecting, standardizing, and analyzing freight spend, carrier performance, and market rate data to support strategic supply chain decisions. This gives shippers the independent data they need to drive cost management decisions and carrier contract negotiations — rather than relying on the carrier's numbers.
What is freight negotiation?
Freight negotiation is the process of agreeing on rates, service levels, accessorial terms, and contract conditions with carriers. The outcome depends heavily on whether the shipper enters with independent data and market benchmarks — or relies on the carrier's proposals as the reference point.
What are the four core information areas in logistics and supply chain management?
The four areas are: transportation spend and rate data, carrier performance and SLA compliance, inventory and shipment visibility, and supplier and contract terms. Freight intelligence dashboards consolidate these into one place, replacing the fragmented approach of managing each area across separate systems.
What KPIs should I track on a freight intelligence dashboard for contract negotiations?
The highest-leverage KPIs are contracted versus invoiced rate variance, accessorial charge frequency and cost by carrier, on-time delivery rate by carrier, spend concentration by carrier, and market rate benchmarks for your highest-volume lanes.
How do freight intelligence dashboards help reduce accessorial charges?
Dashboards track accessorial charges by type, carrier, and frequency over time — creating the documented evidence needed to negotiate waivers, caps, or pre-agreed accessorial schedules. Carriers are far more likely to agree to terms when a shipper arrives with a 12-month charge history than a verbal objection.