Introduction
Healthcare organizations face a genuine financial squeeze. Labor costs keep rising, reimbursements keep shrinking, and supply chain disruptions have become routine rather than exceptional. The instinctive response — cut supply costs — sounds reasonable until you realize that the wrong cuts create downstream expenses that dwarf the original savings. That's the cost-quality trap in practice: decisions that look smart on a spreadsheet quietly erode clinical outcomes — and ultimately cost more.
JAMA research estimates total annual U.S. healthcare waste at $760 billion to $935 billion — roughly 25% of total spending. Administrative complexity and pricing failures, the categories most directly tied to procurement, account for nearly $500 billion of that figure. Capturing even a fraction of that waste requires more than tighter budgets — it requires visibility into what's actually driving cost and quality outcomes.
Supply chain analytics provides that visibility. The sections ahead cover the four analytics types, the metrics that matter, and a practical path to building a program that improves both your balance sheet and your patients' outcomes.
TL;DR
- U.S. hospitals overspend an estimated $25.4 billion annually on supply chain due to data gaps, contract misalignment, and process variation
- The cost-quality tradeoff is often false — analytics frequently reveals that better supply decisions cost less, not more
- Four analytics tiers — descriptive, diagnostic, predictive, and prescriptive — each unlock a specific type of cost or quality improvement
- Key metrics: total cost of ownership, contract compliance rate, perfect order rate, and inventory waste rate
- Start with data integration and benchmarking; quick wins in contract compliance and overstock reduction build momentum fast
The Cost-Quality Tension in Healthcare Supply Chains
Why Supply Chains Become Cost Centers — and Why That's Dangerous
Most health system executives treat supply chain as overhead to minimize. That framing produces fragmented procurement decisions, siloed data across ERP and EHR systems, and what supply chain professionals call "emotional buying": over-ordering driven by shortage anxiety rather than actual demand data.
The financial consequences are well-documented. U.S. hospitals overspend approximately $25.4 billion annually on supply chain operations, linked primarily to data quality issues and contract misalignment. Meanwhile, external spend — supplies, services, pharmaceuticals — can reach up to 40% of a health system's total costs, according to McKinsey.
The False Economy of Low-Price Procurement
Choosing the lowest-priced item without clinical evidence creates what's commonly called the false economy trap. Consider surgical gloves: a 2025 study published in the Journal of Hospital Infection found that glove breaches are associated with a twofold increase in surgical site infection (SSI) risk. Lower-quality gloves selected on price increase breach rates — and SSIs carry an estimated $10 billion annual economic burden for U.S. providers.
The same dynamic plays out across catheters, skin prep supplies, implants, and dozens of other categories. In each case, the cheapest unit price often generates the highest downstream clinical cost — which is exactly the problem analytics is designed to expose.
Reframing the Goal
Supply chain analytics doesn't force a choice between cost and quality. It finds the point where spending the right amount on the right supplies produces the best clinical and financial outcomes — and gives decision-makers the data to act on that insight consistently.
What Is Healthcare Supply Chain Analytics?
Healthcare supply chain analytics uses data collection, integration, and analysis tools to examine procurement, inventory, logistics, and clinical utilization data — with the goal of reducing waste, improving efficiency, and connecting supply decisions to patient and financial outcomes.
The data that feeds these systems comes from multiple sources:
- ERP systems — item master data, pricing, contract terms, purchase orders
- EHR systems — clinical utilization, patient outcomes, procedure volumes
- SCM/WMS platforms — inventory tracking, RFID data, barcode scanning, distribution records
The problem most organizations face before analytics can work: 58% report challenges with data standardization across different systems, and 55% cite legacy infrastructure as their primary barrier to interoperability. Analytics built on fragmented, inconsistent data produces misleading insights. Data integration has to come first — before any reporting layer can be trusted.
Descriptive and Diagnostic Analytics
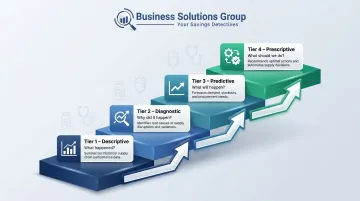
Descriptive analytics examines historical supply chain events to answer: what happened? Spend dashboards, usage reports, and inventory snapshots all fall here.
A practical example: identifying that a specific surgical department's PPE consumption spikes 30% every January, or that supply costs per procedure vary by 40% across two facilities performing the same operation.
Diagnostic analytics goes one layer deeper to answer why it happened. When descriptive analysis flags a stockout in perioperative services, diagnostic analysis determines whether the cause was a supplier failure, a PAR level set too low, or a demand spike that no one anticipated. Without that root-cause layer, the same stockout will recur regardless of how many purchase orders get expedited.
Predictive and Prescriptive Analytics
Predictive analytics uses historical data and machine learning models to forecast what will happen before it does. In supply chain terms, that means anticipating demand shifts, flagging items approaching expiration, and projecting inventory needs by location and procedure type. A 2025 systematic review found that predictive analytics in healthcare supply chains improves demand forecast accuracy by 25%, with corresponding improvements in on-time delivery rates and supplier reliability.
Prescriptive analytics converts forecasts into specific recommendations. Rather than just predicting a stockout, prescriptive tools recommend restocking protocols, flag substitution options, or trigger automated reorder processes.
Automated dispensing cabinets that adjust par levels based on usage rates and expiration windows are one practical application. Organizations reaching this tier have typically resolved their data integration challenges and are ready to move from reactive purchasing to proactive supply management.
Key Metrics That Define the Cost-Quality Equation
Not all metrics move the needle. These five span procurement, inventory, and supplier performance — and each one directly shifts decisions when tracked consistently.
Total Cost of Ownership (TCO)
Purchase price is the least useful number in procurement. TCO captures the full cost of a supply item: acquisition, handling, sterilization, maintenance, disposal, and downstream clinical costs triggered by product performance.
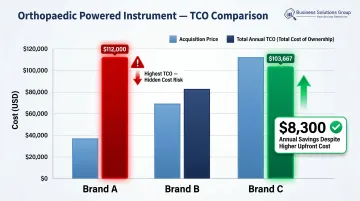
A 2022 TCO study published by HMPI compared three orthopaedic powered instrument brands. The brand with the lowest acquisition price had the highest annual TCO at $112,000 — driven by expensive two-stage sterilization requirements. The highest-priced brand had a TCO of $103,667, saving the hospital roughly $8,300 per year despite costing more upfront.
Cost of Quality
The cost of quality has two components:
- Conformance costs — what you spend to prevent failures: supplier auditing, product standardization, inspection
- Non-conformance costs — what failures actually cost: expired inventory, adverse patient events, rework, emergency repurchase
For most healthcare organizations, non-conformance costs are invisible until analytics makes them measurable. GHX inventory data shows organizations average $90,000 in expired supplies annually, with large acute care systems exceeding $1 million — and up to 20% of surgical supply costs come from unused and expired items.
Contract Compliance Rate
Contract compliance tracks the percentage of purchases made from contracted suppliers at contracted prices. Off-contract purchasing — commonly called "maverick spend" — erodes GPO savings immediately. If 20% of a hospital's purchased services spend occurs off-contract, the savings that GPO negotiations were supposed to deliver disappear.
Analytics tools that surface contract leakage in real time give supply chain leaders the visibility needed to course-correct before the budget impact compounds.
Inventory Performance Metrics
Three inventory metrics that together reveal waste and readiness:
- Stockout rate — how often supply unavailability disrupts care or triggers emergency purchasing at premium prices
- Overstock/waste rate — how much capital is locked in excess inventory, including items that expire unused
- Inventory turnover — how efficiently inventory cycles through the system
Enterprise-wide inventory visibility eliminates emotional buying. When departments can see system-level stock rather than just their own shelf, over-ordering driven by shortage anxiety drops sharply.
Perfect Order Rate
AHRMM defines a perfect order as one delivered on time, complete, damage-free, and accurately invoiced — with no human intervention required. The overall rate is calculated by multiplying four sub-rates together, so weakness in any single dimension pulls the composite score down significantly.
AHRMM's benchmarks target a fill rate of 93% to 98%. Organizations below that threshold are absorbing hidden costs in expediting, substitutions, clinical disruptions, and administrative rework. A consistently low perfect order rate is rarely a vendor problem — it usually signals a gap in order accuracy, forecasting, or contract terms worth auditing.
How Analytics Closes the Gap Between Cost Savings and Care Quality
Demand Forecasting and Inventory Optimization
Accurate demand modeling eliminates both ends of the inventory problem: the overstock that locks up capital and generates expired waste, and the stockout that disrupts procedures and triggers emergency purchases at inflated prices.
The ROI from getting this right is significant. Two health systems illustrate what's possible:
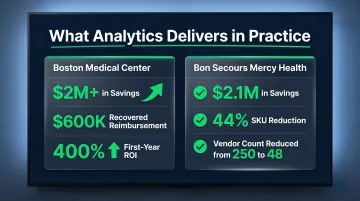
- Boston Medical Center identified over $2 million in savings plus $600,000 in recovered reimbursement, delivering a 400% ROI in the first year
- Bon Secours Mercy Health captured $2.1 million in savings by cutting SKU count 44% and reducing vendors from 250 to 48
Clinical-Supply Integration: Linking Products to Outcomes
The most powerful application of analytics is connecting EHR clinical outcome data to supply procurement data, a practice HIMSS formalized through its Clinically Integrated Supply Outcomes Model (CISOM).
When organizations can compare two clinically equivalent items and see that the lower-cost option correlates with fewer surgical site infections, the procurement decision becomes straightforward: the cheaper product is also the better one. Ochsner Health System did exactly this by using outcome data to identify variation in skin prep supplies across surgical sites that was contributing to SSIs, then standardizing based on evidence rather than price.
Reducing Waste and Improving Procurement
Enterprise-wide visibility enables system-wide waste reduction rather than managing each facility in isolation. Specific levers include:
- NDC standardization: reduces therapeutic duplicates and off-formulary purchases across facilities
- Surgical kit rationalization: removes low-use items from procedure packs based on actual consumption data
- Spend consolidation: redirects off-contract spend to contracted suppliers through real-time compliance monitoring
Spend analytics tools identify pricing anomalies, supplier concentration risks, and benchmark gaps that inform contract renegotiations. Platforms that surface these patterns give supply chain leaders the benchmarks they need to negotiate from data rather than intuition — without compromising the quality standards embedded in those contracts. Business Solutions Group's spend intelligence platform is built for exactly this purpose, providing healthcare organizations with actionable pricing visibility and contract compliance tracking in one place.
Agility and Disruption Response
The pandemic exposed how quickly supply chain disruptions cascade into patient care failures. Analytics enables a faster, more structured response. Organizations with real-time demand signals and supplier risk dashboards in place before 2020 were able to identify alternative sources, shift purchasing across facilities, and prioritize critical SKUs weeks ahead of those relying on manual processes. The same visibility that drives everyday waste reduction becomes a crisis management tool when disruption hits — turning reactive scrambling into informed, coordinated action.