Introduction
Freight spend is one of the largest controllable cost lines in a business — and most companies are overpaying without knowing it. US business logistics costs hit $2.58 trillion in 2024 — roughly 8.8% of national GDP — according to the CSCMP's 36th Annual State of Logistics Report. For CPG companies alone, distribution and transportation costs run 6–8% of revenue, with inefficient networks leaving as much as 25% of that spend recoverable.
The frustrating part? Most of that waste isn't caused by bad market conditions. It's caused by decisions made before a shipment is ever booked — defaulting to spot rates, shipping partial loads on fixed schedules, or letting carrier invoices pass through unchecked.
Freight costs are manageable. What drives them up is how freight is managed — not just what the market charges.
This guide organizes 11+ reduction strategies across three levers: decisions made before booking, how freight is actively managed, and the operational context around it. Each lever contains specific, actionable tactics with no generic rate-shopping advice.
Key Takeaways
- Most freight overpayment originates before the shipment is booked — in mode selection, load planning, and packaging decisions
- Auditing invoices and benchmarking carrier rates are the fastest ways to recover money already being lost
- Consolidating shipments and locking in contract rates reduce exposure to spot market volatility
- TMS platforms and spend intelligence tools replace reactive firefighting with real-time cost control
- Sustainable savings require ongoing visibility — not one-time negotiations
How Freight Costs Build Up (And Why Most Shippers Miss It)
Freight costs rarely appear as a single alarming line item. They accumulate through base rates, fuel surcharges, accessorial fees, and billing errors — each minor on its own, but compounding across hundreds or thousands of shipments per year.
The problem stays invisible until volume pressure or a contract renewal forces a review — by which point the overpayment has often been running for months.
The Billing Error Problem
Industry research estimates that 5–15% of freight invoices contain errors, with mid-market shippers losing 3–7% of total freight spend annually to billing discrepancies. At scale, that's a six- or seven-figure annual leak — from charges that passed through unchallenged.
Operational Habits That Drive Cost
Common behaviors that silently inflate freight spend include:
- Defaulting to the same carriers without periodic benchmarking
- Booking on the spot market reactively rather than through negotiated contracts
- Shipping on fixed schedules regardless of load fill rate
- Skipping invoice audits because the process feels too time-consuming
Most freight cost problems are structural, not cyclical. Carrier rate shopping addresses the symptom; fixing the underlying habits is what closes the gap.
Key Cost Drivers in Freight Shipping
Freight pricing is driven by weight, dimensions, freight class, distance, and delivery conditions. Errors in any of these inputs inflate the final cost — often without anyone noticing until an audit.
Spot vs. Contract Rate Exposure
Carrier relationship structure is one of the largest cost drivers. As of late 2025, dry van contract rates averaged $2.44/mile versus spot at $2.25/mile in a loose market. But C.H. Robinson's April 2026 freight market update revised its full-year 2026 dry van cost forecast to +17% year-over-year as capacity tightens. When spot rates spike, shippers without contracted coverage absorb the full increase.
Rate volatility like this makes it harder to know whether your negotiated lanes are still competitive. Without benchmark data, overpayment can persist quietly for years. Business Solutions Group's benchmark analysis compares current rates against real market data at the lane level — clients who haven't had an outside review in 2–3 years typically find 20–25% savings on LTL spend.
Accessorial Charges: The Hidden Multiplier
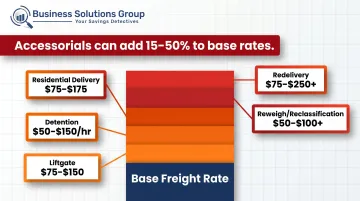
Accessorial fees — detention, liftgate, residential delivery, reclassification — can add 15–50% on top of base freight rates, and some are rising 10–30% annually, outpacing base rate increases. Unlike base rates, accessorials are largely controllable with better planning and preparation.
Cost-Reduction Strategies: Changing Decisions Before Booking
The most impactful freight savings happen before a shipment is booked. Mode, volume, timing, and packaging decisions set the cost ceiling. Everything after booking is damage control.
Consolidate Shipments to Reduce Partial-Load Costs
Truckload underutilization rose from 43% in 2023 to 58% in 2024, with partially empty loads leaving an average of 34 linear feet of deck space unused. That unused space represents real money: shippers pay for capacity they're not filling, while carriers absorb the operational inefficiency.
Consolidating multiple LTL shipments into fewer full loads shifts pricing from per-pallet LTL rates to lower FTL rates. Consolidation makes practical sense when:
- Multiple orders share a destination region
- Delivery windows have flexibility of 1–2 days
- Recurring orders can be batched weekly rather than shipped as they're placed
Reviewing shipping patterns quarterly regularly uncovers consolidation opportunities that aren't obvious at the individual shipment level.
Choose the Right Mode for Each Shipment
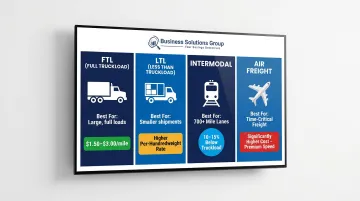
Defaulting to a single mode for all shipments is one of the most avoidable sources of freight cost. Each mode has a cost-appropriate use case:
| Mode | Best For | Cost Profile |
|---|---|---|
| FTL | Large loads, dedicated capacity | $1.50–$3.00/mile |
| LTL | Smaller shipments, flexible timing | Higher per-hundredweight |
| Intermodal | Lanes 700+ miles, non-urgent | 10–15% below truckload |
| Air freight | Time-critical, high-value freight | Significantly higher |
Lock In Contract Rates Instead of Defaulting to Spot
Spot market rates are volatile by design: carriers price in uncertainty, and in a tightening market like 2026, that uncertainty gets expensive fast.
Volume commitments, consistent lane data, and carrier relationship history all create negotiating leverage. A freight advisory partner can put that leverage to work through direct carrier negotiations, using market-rate intelligence and bid tools — with contracts held in the client's name. Business Solutions Group has delivered over $500 million in collective LTL savings this way, with typical results ranging from 15–35% per engagement.
Optimize Packaging Dimensions and Weight
Dimensional weight pricing can inflate shipping costs by 40–200% for lightweight, bulky freight compared to actual-weight pricing. Carriers also apply reweigh fees of $50–$100 per occurrence and reclassification penalties that can add hundreds to a single shipment when the bill of lading doesn't match actual freight characteristics.
Practical steps:
- Right-size boxes to reduce void space
- Maximize pallet density before booking
- Ensure freight class on the BOL matches actual commodity and dimensions
- Review packaging standards when carrier surcharges appear repeatedly
Use Off-Peak Shipping Windows to Access Lower Rates
Carrier capacity and pricing fluctuate based on time of day, day of week, and seasonal cycles. Early-week shipping (Monday–Tuesday) and off-peak hours often give carriers flexibility to negotiate lower rates rather than let trucks sit idle. Not every lane will have this flexibility, but on routes where delivery timing isn't fixed, testing off-peak windows can yield meaningful rate reductions.
Cost-Reduction Strategies: Changing How Freight Is Managed
Once shipping decisions are made, poor day-to-day management is where most ongoing freight overpayment happens. The following practices address the operational gaps that keep costs elevated.
Implement a Regular Freight Audit Process
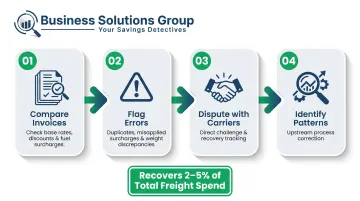
Implementing a freight audit and payment process typically recovers 2–5% of total freight spend through error detection alone. The audit process involves:
- Comparing each invoice against contract terms — base rates, discounts, fuel surcharge calculations
- Flagging duplicate charges, misapplied surcharges, and weight discrepancies
- Disputing errors directly with carriers and tracking recovery amounts
- Identifying recurring error patterns for process correction upstream
Business Solutions Group's freight audit service covers all modes — parcel, LTL, FTL, air, ocean, and rail — and includes direct carrier dispute management with monthly reporting on credits and corrections. Most clients see recovered credits within the first billing cycle.
Actively Track and Reduce Accessorial Charges
The most common accessorial fees — and what typically causes them:
| Charge | Typical Range | Common Cause |
|---|---|---|
| Liftgate | $75–$150 | Unconfirmed dock availability |
| Detention | $50–$150/hour | Freight not staged at pickup |
| Residential delivery | $75–$175 | Incorrect address classification |
| Reweigh/reclassification | $50–$100+ | Inaccurate BOL |
| Redelivery | $75–$250+ | Missed delivery windows |
Most of these are preventable. Stage freight before pickup, confirm dock availability in advance, and verify freight class and dimensions before the BOL is created.
Use a TMS for Centralized Control
Organizations using a TMS typically save 5–10% of their transportation budget, with fully managed TMS programs delivering over 12%. The operational value comes from consolidating carrier selection, route planning, load tracking, and billing into one system. That single platform replaces the manual processes that generate errors and blind spots.
Business Solutions Group's TMS solution supports all shipping modes (parcel, LTL, FTL, air, ocean, rail) with real-time carrier rates, automated exception alerts, invoice auditing, and ERP integration via open API. Clients gain a single control point rather than managing freight across disconnected systems.
Benchmark Carrier Rates Against Market Data
Most shippers assume their negotiated rates are competitive. Many are wrong. Companies that haven't had an independent benchmark review in 2–3 years are frequently overpaying by 15–30% on lanes where better terms are available.
Business Solutions Group's benchmark analysis evaluates current shipping rates against proprietary market-rate intelligence — covering base rates, fuel surcharges, accessorials, zone increments, and rate escalators. The no-cost analysis is completed within 3–5 business days and delivers findings at the lane level, showing exactly where renegotiation is warranted and what realistic savings look like.
Monitor KPIs to Drive Continuous Improvement
Tracking performance over time is what separates sustained cost reduction from one-time savings. Key metrics to monitor regularly:
- Cost per mile — benchmark against ATRI's 2024 average of $2.26/mile
- Accessorial charge frequency — rising rates signal process breakdowns upstream
- On-time delivery rate — the 2024 LTL average was 82%; poor performance triggers OTIF penalties
- LTL utilization rate — target above 84%; below 70% signals consolidation opportunity
- Freight spend as a percentage of revenue — industry benchmark for CPG is 6–8%
Cost-Reduction Strategies: Changing the Operational Context
Some of the highest-impact reductions require addressing the environment around shipments — routes, carrier relationships, and transportation model — not just individual shipment decisions.
Optimize Routes to Reduce Miles and Fuel Surcharge Exposure
Route optimization can eliminate 15–30% of unnecessary fuel consumption without capital investment. At scale, the math compounds: one case study documented cutting 4.5 million miles annually through route re-optimization. Since fuel surcharges are calculated as a percentage of base rates, fewer miles means lower surcharge exposure on every lane.
Consolidate Carrier Relationships for Volume Leverage
Spreading freight volume across too many carriers dilutes negotiating leverage and adds administrative complexity. Concentrating volume into a smaller number of strategic partnerships unlocks measurable advantages:
- Better negotiated rates through committed volume
- Priority capacity access during tight markets
- More favorable contract terms and service accountability
Business Solutions Group's carrier procurement process combines competitive sourcing with performance-focused contracting. Advanced bid tools model scenarios across multiple carriers simultaneously, and contract structures hold carriers accountable to both price and service commitments.
Arrange Backhauling to Reduce Dead-Leg Costs
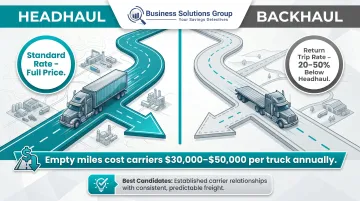
Empty miles cost carriers $30,000–$50,000 per truck annually and represent 20.6% of total miles for all carriers. Backhaul loads — freight carried on a carrier's return trip — are typically priced 20–50% below headhaul rates because carriers strongly prefer partial revenue over a deadhead run.
Capturing backhaul opportunities requires coordination with carriers on their lane patterns and return routes. The strongest candidates are carriers where you have an established relationship and can offer consistent, predictable freight — giving them a reason to route return trips around your loads.
Explore Intermodal for Long-Haul Lanes
On lanes exceeding 700 miles with good terminal access, intermodal saves 10–15% compared to over-the-road truckload. The tradeoff is usually 1–2 additional days of transit time — acceptable for non-urgent freight and significantly valuable at high shipment volumes.
Intermodal also provides a capacity buffer that holds when truck availability tightens. When spot rates spike and over-the-road capacity shrinks, intermodal commitments don't evaporate — making the mode's reliability as valuable as its rate savings.
Conclusion
Sustainable freight cost reduction starts before the carrier conversation. The real leverage is in understanding where cost originates — in pre-booking decisions, active shipping processes, or broader operational structure — and addressing each layer deliberately.
That systematic approach is what separates shippers who stay ahead from those who don't. Shippers who audit consistently, benchmark regularly, and track the right KPIs hold their ground regardless of market conditions. Those who skip those steps absorb rate increases that better-positioned competitors aren't paying.
If you haven't had an independent review of your freight spend, Business Solutions Group's no-cost benchmark analysis is a straightforward next step. Findings are delivered at the lane level within 3–5 business days, with no commitment required to act on them.
Frequently Asked Questions
How can I reduce my freight costs?
Start with a freight invoice audit to recover charges already being lost, then benchmark your carrier rates against market data to identify lanes where renegotiation is warranted. Consolidating LTL shipments into fuller loads typically delivers the next layer of savings with minimal operational disruption.
What percentage of your budget should transportation costs be?
For most businesses, transportation costs run 4–8% of revenue, with CPG companies typically in the 6–8% range according to Bain & Company. The right target depends on shipment volume, mode mix, and distance — the more important metric is tracking your rate over time and understanding what's driving changes.
What is a common method for reducing transportation costs as a freight broker?
Freight brokers typically reduce costs by using carrier relationships and aggregated volume to access better spot and contract rates than individual shippers can negotiate alone. They also consolidate loads across multiple shippers and match freight to available capacity through load board technology.
What is cost reduction in logistics?
Logistics cost reduction means lowering expenses across transportation, warehousing, and fulfillment without degrading service quality. Unlike simple rate-cutting, the most effective programs combine spend visibility, process optimization, and structural improvements that hold over time.
Will freight rates go up in 2026?
Based on current forecasts, yes. C.H. Robinson projects dry van costs up ~17% year-over-year in 2026 as capacity tightens and operating costs rise. Locking in contract rates now and tightening internal cost controls puts you in the strongest position regardless of where rates land.
What are the 4 pillars of cost optimization?
The four pillars are: visibility (knowing what you spend and where), efficiency (removing waste from process and load utilization), leverage (using volume and data to negotiate better terms), and continuous improvement (monitoring KPIs and adjusting as market conditions shift).