Those numbers translate directly to margin pressure. When last-mile costs rise, free shipping commitments become financially unsustainable, and businesses face an uncomfortable choice between absorbing the cost or pushing it onto customers.
The key point: last-mile costs are not inherently uncontrollable. They become excessive primarily because of poor carrier decisions, absent spend visibility, and operational inefficiencies that compound quietly over time. This article examines where those costs originate and the specific strategies that reduce them.
Key Takeaways
- Last-mile delivery accounts for 41% of overall supply-chain costs and up to 53% of total shipping costs.
- Costs accumulate across fuel, labor, failed deliveries, and carrier surcharges — many of which are avoidable.
- The biggest cost drivers are route inefficiency, weak carrier contracts, failed delivery attempts, and poor spend visibility.
- Reducing costs requires action at three levels: how you negotiate contracts upfront, how you execute routes and deliveries daily, and how you structure carrier relationships long-term.
- Businesses that actively manage last-mile spend — rather than accepting carrier invoices at face value — consistently recover 10–20% in avoidable costs.
How Last-Mile Logistics Costs Build Up
Last-mile costs don't appear as a single line item. They compound across fuel, driver labor, fleet maintenance, technology, and customer-facing failure costs like re-deliveries and returns. That fragmentation makes them easy to underestimate until the invoice arrives and the numbers don't add up.
The Compounding Effect
Cost build-up is typically triggered by specific operational events: a failed delivery attempt, a carrier rate increase, a surge in order volume. Costs don't accumulate uniformly. Businesses often don't recognize the full scope until a route consistently runs over budget or a carrier invoice comes in 20% higher than projected.
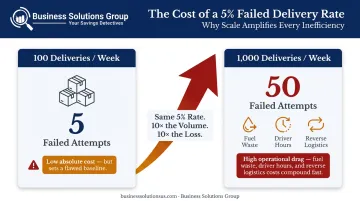
Certain costs also stay hidden until scale exposes them:
- A 5% failed delivery rate looks negligible at 100 deliveries per week
- At 1,000 deliveries per week, that same rate means 50 failed attempts — each generating wasted fuel, driver time, and potential reverse logistics
- Unoptimized routes follow the same pattern: minor inefficiency at low volume, significant cost center at scale
Because these costs are distributed across multiple functions, fixing one in isolation rarely moves the needle. A systematic approach across routing, delivery execution, and carrier contracts is what actually shifts the numbers.
Key Cost Drivers for Last-Mile Logistics
Several drivers consistently account for the bulk of last-mile expense. Knowing which ones apply to your operation is the starting point for meaningful cost reduction.
Fuel and Labor
These are the most direct cost drivers, scaling proportionally with miles driven and driver time on the road. Without route-level visibility, there's no mechanism to distinguish efficient routes from wasteful ones. Fuel and labor spending becomes unmanaged.
Carrier Contract Structure
This is one of the most underexamined cost drivers in logistics. Businesses that renew carrier contracts without benchmarking current market pricing routinely overpay — often without knowing it. A 2020 Supply Chain Dive report quoted a parcel consultant estimating that contract renegotiation can yield savings of 5% to 50% above current discounts for shippers who engage with proper market data.
Closing that gap requires comparing your current carrier rates against live market equivalents — a step most shippers skip entirely during renewal cycles.
Failed Delivery Attempts
Failed deliveries are a compounding cost driver. Loqate's 2021 research found that in the US, 8% of first delivery attempts fail, at an average cost of $17.20 per failed attempt. Each failure adds direct cost, reduces route density efficiency, and can trigger reverse logistics expenses. At volume, even a modest failure rate creates a substantial recurring burden.
Context-Specific Cost Premiums
Cost driver intensity varies significantly by operating environment:
- Urban operations face parking and congestion premiums — searching for parking alone adds an average of 2.3 minutes per delivery in city environments
- Rural operations face distance costs that inflate fuel and labor per delivery
- High-return categories like apparel and groceries carry inherent handling inefficiencies that require different mitigation approaches
Cost-Reduction Strategies for Last-Mile Logistics
Last-mile cost reduction is not a single lever. Strategies need to match where the cost is actually originating — whether in upfront carrier and fleet decisions, operational execution, or the broader structural context around the delivery operation.
Strategies That Change Upfront Decisions
These address cost drivers locked in before a delivery begins. Carrier selection, contract terms, fleet composition, and delivery scope all set the long-term cost baseline.
Renegotiate carrier contracts using benchmark data
Many businesses pay above-market rates simply because they haven't compared their spend against what similar shippers pay. A formal benchmark analysis — mapping current carrier rates against market equivalents — is often the fastest path to cost reduction without any operational changes required.
Business Solutions Group's carrier contract advisory process follows exactly this approach: analyzing parcel invoice history against market-rate data to surface where clients are overpaying before entering any negotiation.
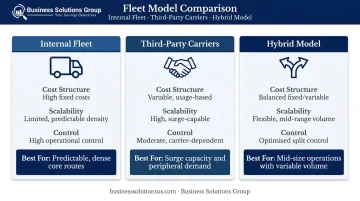
Evaluate fleet mix strategically
The cost trade-offs between fleet options are meaningful:
| Model | Cost Profile | Best For |
|---|---|---|
| Internal fleet | High fixed costs, high control | Predictable, dense core routes |
| Third-party carriers | Variable costs, scalable | Surge demand, peripheral zones |
| Hybrid model | Balanced fixed/variable | Most mid-size operations |
Hybrid approaches — internal fleets for core routes, external providers for surge or peripheral demand — typically deliver the best cost-per-delivery outcome for operations with variable volume patterns.
Adopt eProcurement for carrier sourcing
Businesses that rely on informal or legacy processes to select carriers miss competitive pricing opportunities. Structured eProcurement — digitizing carrier bidding and selection — enables systematic cost comparison and reduces dependence on spot rates or single-carrier lock-in. Business Solutions Group offers advanced eProcurement solutions as part of its logistics advisory services, allowing clients to move from reactive to competitive carrier sourcing.
Audit delivery scope and zone design
Some businesses unknowingly serve high-cost zones at flat rates that don't reflect actual delivery difficulty. Segmenting delivery zones and structuring service — or pricing — accordingly eliminates cost leakage on under-optimized routes.
Strategies That Improve Operational Execution
Route efficiency, driver performance, and real-time coordination determine whether daily execution costs are controlled or wasted. The strategies below target that layer directly.
Implement route optimization
The most executable route accounts for service time variability, time window commitments, driver differences, and delivery density — not just shortest distance. Accenture's 2021 sustainable last-mile research found that route optimization typically yields 7% to 15% efficiency gains in last-mile operations, reducing fuel spend and driver hours simultaneously.
Proactively communicate with customers
Sending confirmation and reminder notifications before delivery reduces no-shows, unplanned returns, and re-delivery runs. Given that each failed attempt costs an average of $17.20 in the US, improving customer-side visibility is one of the highest-ROI operational changes available — low implementation cost, direct impact on a high-frequency cost driver.
Digitize proof of delivery
Photographic, timestamped, and geo-stamped proof of delivery:
- Reduces customer disputes and fraudulent damage claims
- Accelerates invoicing and revenue recovery
- Provides an audit trail that protects against liability exposure
Track cost-per-delivery metrics consistently
Without measurement at the route, zone, or delivery-type level, there's no way to distinguish efficient areas of the operation from wasteful ones. Business Solutions Group's spend intelligence platform tracks cost variance, margin analysis, and delivery performance across the business — providing visibility that standard carrier invoicing doesn't offer.
Ongoing metric tracking sustains that improvement. Cost patterns shift as volume, routes, and carrier pricing change, so a one-time audit won't hold.
Strategies That Change the Structural Context
In many cases, the surrounding structure — where inventory sits, how demand is shaped, how delivery volume is aggregated — is the real cost driver. Operational improvements alone can't fully compensate for structural inefficiency.
Shorten physical delivery distance through micro-fulfillment or ship-from-store
Positioning inventory closer to end customers reduces the mileage burden on every delivery. The results from retailers that have done this are instructive.
Walmart reduced store-to-home delivery costs by approximately 20% in 2024, with its CFO crediting improvements partly to "densifying the last mile" by delivering more packages per route. Target cut digital fulfillment cost per order by 30% using stores as fulfillment hubs. This approach works best when demand patterns are predictable enough to justify forward-staging inventory.
Improve delivery density by aggregating time windows
Dispatching deliveries to the same zone across different time slots reduces route density. When customers choose consolidated delivery windows — scheduled next-day rather than on-demand — the number of trips required per area drops meaningfully. Encouraging this shift can reduce per-delivery cost without requiring any carrier or fleet changes.
Use multi-carrier platforms to access flexible, competitive routing
Relying on a single carrier creates exposure to rate increases, capacity limits, and service failures. Platforms that aggregate multiple delivery providers — routing each delivery to the most cost-efficient and available option in real time — provide both cost flexibility and resilience. Business Solutions Group's Transportation Management System (TMS) supports this multi-carrier approach as part of its managed logistics offering.
Shift demand toward lower-cost fulfillment channels
Pickup and click-and-collect options reduce last-mile delivery volume directly. The WEF's 2024 urban logistics report found that PUDO (pick-up/drop-off) networks can lower delivery costs by up to 15% and reduce total delivery trips by a similar margin. Offering incentives — financial or informational — that encourage customers to choose in-store or curbside pickup over home delivery can shift a meaningful portion of volume without damaging satisfaction.
Conclusion
Effective last-mile cost reduction starts with identifying where cost actually originates — carrier contract gaps, route inefficiency, failed deliveries, or structural distance problems — and applying targeted strategies at each source.
Cost reduction is a continuous discipline, not a one-time initiative. Businesses that build measurement, benchmarking, and carrier management into ongoing operations consistently outperform those that treat delivery costs as fixed overhead.
That's the premise behind how Business Solutions Group approaches logistics advisory — its performance-based model ties the engagement to sustained savings across carrier contracts, routing, and spend intelligence, not just an initial negotiation win.
Frequently Asked Questions
What are the costs associated with last-mile delivery?
The main cost components are fuel, driver labor, fleet or carrier fees, technology, and failure-related costs like re-deliveries and returns. Depending on the sector and denominator used, industry sources place last-mile at roughly 41% of overall supply-chain costs and up to 53% of total shipping costs.
Why is last-mile logistics so expensive?
Each delivery requires a separate pickup, routing decision, and hand-off to an individual customer — a structure that's difficult to scale efficiently. Failed attempts, urban congestion, and the expectation of fast, free delivery further compress margins by limiting how much cost can be passed to customers.
How do you reduce last-mile delivery costs?
Cost reduction works across three levels: carrier contract and fleet decisions upfront, route efficiency and customer communication during execution, and inventory positioning and delivery density at the structural level. Focusing on just one layer while ignoring the others typically produces limited results.
How do failed deliveries contribute to last-mile costs?
Each failed attempt generates wasted fuel, driver time, and potential reverse logistics costs — averaging $17.20 per failed first delivery in the US. At scale, even an 8% failure rate creates a substantial recurring expense that proactive customer communication can largely prevent.
What role does carrier contract negotiation play in reducing last-mile costs?
Many businesses renew carrier agreements without benchmarking current market rates, leaving significant savings unrealized. Renegotiating with current market data — or working with an advisory firm to do so — can yield 5% to 50% in additional discounts, making it one of the fastest-impact levers available.
Can route optimization alone significantly reduce last-mile delivery costs?
Route optimization typically yields 7% to 15% efficiency gains in fuel and labor costs, but those gains are limited if carrier rates, failed deliveries, and delivery density go unaddressed. It works best as one component of a broader cost reduction approach.