The math is unforgiving. UPS and FedEx have both raised general rates by 5.9% for the third consecutive year, fuel surcharges are running 8–18% on top of base rates, and customer expectations for free, fast delivery aren't softening. Margins get squeezed from both sides simultaneously.
This guide gives you the exact formulas to calculate your true shipping cost margin, 2026 benchmark targets by product type, a breakdown of hidden fees most businesses never track, and concrete strategies to close the gap between what you're spending and what top performers spend.
Key Takeaways
- Shipping costs should fall between 5–12% of revenue for most product categories; above 15% requires immediate action.
- Shipping margin = what you charge customers minus your true all-in cost — and most businesses underestimate that cost by 20–30%.
- Hidden fees (DIM charges, residential surcharges, peak add-ons) can add 5–15% to total shipping spend if unmonitored.
- Free shipping thresholds set at 1.3–1.5x your average order value offset costs while lifting order size.
- Top-performing merchants achieve 6–9% shipping cost-to-revenue ratios through carrier negotiations and packaging optimization.
What Is Shipping Cost Margin and Why It Matters in 2026
Shipping cost margin is the difference between what a business collects in shipping revenue (or absorbs as a cost) and what it actually pays to carriers and fulfillment providers — expressed as a percentage of total revenue. It's distinct from gross margin (which subtracts COGS) and net margin (which subtracts everything). Treated as its own performance metric, it fills a blind spot that standard P&L reporting often misses.
Absorbing free shipping costs blindly — silently destroys margin. Merchants absorb $5–$15 per order in fulfillment costs without knowing which orders are profitable.
Avoiding both traps requires per-order cost visibility — so every pricing decision reflects what you're actually spending, not what you're guessing.
How to Calculate Your Shipping Cost Margin: Step-by-Step
Step 1: Calculate Your True All-In Shipping Cost
Carrier label fees are only one piece. Your real shipping cost includes:
Total Shipping Cost = Carrier Fees + Packaging Costs + Fulfillment/Handling Labor + Technology Fees
Example — a business shipping 1,000 orders/month:
| Cost Component | Monthly Amount |
|---|---|
| Carrier fees | $8,500 |
| Packaging materials | $1,200 |
| Fulfillment/handling labor | $2,800 |
| TMS/shipping software | $500 |
| Total True Shipping Cost | $13,000 |

Most businesses only count the $8,500 carrier line. That leaves a $4,500 blind spot unaccounted for each month.
Step 2: Calculate Your Shipping Cost-to-Revenue Ratio
Shipping Cost-to-Revenue Ratio = (Total Shipping Costs ÷ Total Sales Revenue) × 100
Using the example above with $130,000 monthly revenue:
$13,000 ÷ $130,000 × 100 = 10% shipping cost-to-revenue ratio
That 10% sits within the acceptable range, but only because we used the true all-in cost. Using just carrier fees ($8,500) would have shown a misleading 6.5%.
Step 3: Calculate Gross Margin With and Without Shipping
Most businesses calculate gross margin excluding shipping:
Gross Margin (excl. shipping) = (Revenue − COGS) ÷ Revenue × 100
Gross Margin (incl. shipping) = (Revenue − COGS − Shipping Costs) ÷ Revenue × 100
The gap between these two figures is the true cost of your shipping strategy on profitability. If your gross margin drops from 45% to 35% once shipping is included, that 10-point gap is your shipping tax. It's a number worth knowing — and acting on.
Step 4: Per-Order Cost and Cost Recovery Rate
Per-Order Shipping Cost = Total Shipping Costs ÷ Total Orders
Cost Recovery Rate = (Shipping Fees Charged to Customers ÷ Total Shipping Costs) × 100
A recovery rate below 70% means you're subsidizing more than 30 cents of every dollar spent on shipping. Whether that's viable depends on whether your contribution margins can carry the weight — which Step 5 reveals.
Step 5: Contribution Margin Check
Contribution margin reveals whether individual orders are profitable after all variable costs, including every shipping fee.
Example:
- Selling price: $100
- COGS: $60
- Shipping (all-in, including surcharges): $15
- Contribution margin: $25 — not $40
Treating shipping as a fixed cost overstates margins every time. That $15 figure needs to include dimensional weight charges, residential surcharges, and packaging — not just the label cost.
2026 Shipping Cost Benchmarks by Product Type
Target Ranges by Category
| Product Category | Shipping as % of Revenue |
|---|---|
| Small/Light (<1 lb) | 5–10% |
| Medium (1–5 lbs) | 8–14% |
| Heavy/Oversized (5+ lbs) | 12–22% |
| Free Shipping Threshold Orders | 6–12% |
| International/Cross-Border | 15–30% |
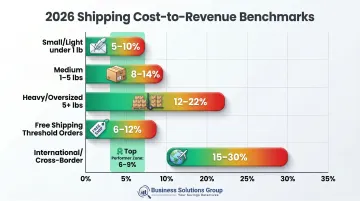
Top-performing merchants achieve 6–9% across their blended mix. According to 2026 shipping benchmark data, most brands currently overspend by approximately 4 percentage points relative to these targets.
Shipping costs above 15% of revenue indicate a structural issue that goes beyond isolated variance. The most common root causes:
- Wrong carrier mix for your shipment profile
- Unoptimized packaging driving dimensional weight charges
- Excessive free shipping subsidization without AOV thresholds
- Untracked surcharges accumulating across billing cycles
Free Shipping Threshold Math
Set your threshold at 1.3–1.5x your current average order value (AOV). The same $6 shipping cost produces very different margin outcomes depending on order size:
- At a $60 order: $6 shipping cost = 10% of revenue
- At an $80 order (after threshold lifts AOV): same $6 cost = 7.5% of revenue
The U.S. average free shipping threshold sits at $64. Mature DTC brands typically set theirs between $75–$100. If your AOV is $55, a $72–$80 threshold is the right starting range — and 58% of shoppers will add items to reach it.
Gross Margin Context
Average ecommerce net profit margin runs around 10%, with high-performing businesses reaching 20% or above. Unmanaged shipping can erode 10–15 percentage points of gross margin, making net margin targets unreachable even with tight COGS management. For businesses already operating on thin margins, that gap is the difference between profitability and loss.
Hidden Shipping Costs That Are Silently Eating Your Margins
Hidden Shipping Costs That Are Eating Your Margins
Dimensional Weight (DIM) Charges
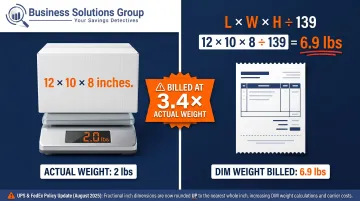
Carriers charge based on whichever is greater — actual weight or DIM weight.
DIM Weight = (L × W × H) ÷ 139 (standard UPS/FedEx divisor for commercial shipments)
Example: A lightweight candle in a 12" × 10" × 8" box:
- DIM weight = (12 × 10 × 8) ÷ 139 = 6.9 lbs
- Actual weight: 2 lbs
- You're billed at 6.9 lbs — 3.4x the actual weight
One more wrinkle: as of August 2025, both FedEx and UPS now round up every fractional inch in DIM calculations. A 9.1" dimension bills as 10". That rounding change alone can shift shipments into higher billing tiers.
Residential and Delivery Area Surcharges
Approximately 80% of ecommerce shipments go to residential addresses — and both FedEx and UPS charge an additional $6.15 per package for residential ground deliveries, rising to $8.15 for extended delivery areas. These fees are auto-applied, retroactive, and easy to miss across aggregate billing.
For residential-heavy shipping lanes, evaluate USPS or regional carriers as alternatives. Address verification tools can also help route shipments more accurately before they're labeled.
Residential surcharges are fixed — but the next two cost categories move with the calendar and the fuel market.
Peak Season and Fuel Surcharges That Stack
Peak surcharges (typically September through mid-January) can inflate effective per-shipment rates by 15–25% during Q4. Fuel surcharges represent the single largest surcharge category at 25–30% of total surcharge spend, and they fluctuate weekly based on diesel and jet fuel averages.
Neither fee shows up as a separate line item in most P&L reviews. Build both into your Q4 margin projections before the season hits.
Address Correction Fees and Return Costs
Address correction fees of $21–$25.50 per package (rates vary by carrier and correction type) apply post-shipment — even if the package is eventually delivered. A batch of 50 bad addresses in one month adds up to $1,000+ in fees.
Returns are a larger problem. Online sales return rates are projected at 19.3% in 2025, and reverse logistics can cost 2–3x forward fulfillment per unit. Processing a single return can consume 20–65% of the product's original value.
Pre-checkout address validation and SKU-level return rate analysis are the two fastest ways to attack both cost centers.
6 Proven Strategies to Boost Shipping Profit Margins in 2026
Optimize Packaging to Reduce DIM Weight Charges
Even small reductions in box dimensions can move a shipment into a lower billing tier. Practical tactics:
- Use the smallest appropriate box for each SKU
- Eliminate excess void fill where it doesn't protect the product
- Test custom-sized packaging for your highest-volume items
- Evaluate flat-pack or nesting options for stackable products
Business Solutions Group includes DIM weight and packaging optimization in its freight cost reduction advisory, analyzing parcel spend to pinpoint dimensional inefficiencies that quietly drive up carrier bills.
Negotiate Carrier Contracts Using Benchmark Data
Published carrier rates are negotiable. Businesses with consistent shipping volume can secure meaningful discounts, but entering those conversations without competitive benchmark data typically means accepting worse terms than the market offers.
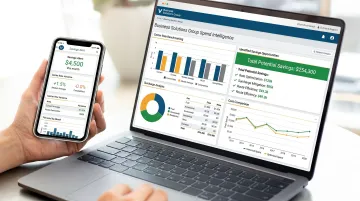
A supply chain advisory partner closes that gap. Business Solutions Group's proprietary spend intelligence software analyzes 6–12 months of shipment data and benchmarks current tariffs against market-rate intelligence across thousands of pricing agreements. It surfaces savings buried in fuel surcharges, accessorial minimums, routing logic, DIM weight rules, and dozens of other cost drivers.
The results are documented: clients typically achieve 15–40% reductions in small parcel shipping costs, with current-year benchmarking discovering average savings of 23.6%. The full negotiation process takes 6–8 weeks. Most of those savings come from renegotiating existing carrier agreements — no carrier switch required.
Implement Rate Shopping and Multi-Carrier Strategy
Routing every shipment through a single carrier leaves consistent savings on the table. Rate shopping — comparing live rates across UPS, FedEx, USPS, and regional carriers for each shipment — typically yields 8–15% savings per shipment.
Business Solutions Group's TMS Rate Shopping Tool consolidates all carrier rates into a single dashboard, with real-time quoting, automated auditing, and integrated tracking. The platform is designed for shippers spending $500,000 or less annually and is available at little to no cost to implement.
Match carrier selection to shipment profile:
- Residential vs. commercial delivery
- Domestic standard vs. expedited
- Cross-border vs. domestic
- Parcel vs. LTL at higher weights
Frequently Asked Questions
What is a good percentage of shipping costs?
For most businesses, shipping costs should stay under 12% of revenue. Top performers achieve 6–9% through carrier negotiations, packaging optimization, and multi-carrier routing. Above 15% is a red flag that typically points to structural inefficiencies requiring immediate review.
Does gross margin include shipping?
Standard gross margin calculation subtracts COGS from revenue — shipping is excluded. But every business should calculate a separate "gross margin including shipping" figure. Track it as a variable expense line item to see true per-order profitability.
Is 20% margin the same as 25% markup?
No — they use different bases. A 25% markup adds 25% to your cost price; a 20% margin means profit is 20% of the selling price. A $10 cost with a 25% markup yields a $12.50 selling price — that's a 20% margin on revenue. Don't conflate the two when evaluating shipping cost impact.
How much does it cost to ship a 100lb item?
At 100 lbs, LTL freight often becomes cost-competitive with parcel. UPS and FedEx Ground cap at 150 lbs but apply Additional Handling surcharges ($22.00) above 50 lbs. LTL rates average $2–$5 per mile depending on freight class, density, and destination zone.
How do I reach a 40% profit margin?
Achieving 40% means managing COGS, operating costs, and shipping in parallel. On shipping: target a cost-to-revenue ratio under 10%, audit invoices to eliminate hidden surcharges, and use free shipping thresholds to lift AOV without proportional cost increases.