For transportation and logistics managers, this history isn't just interesting — it's directly useful. Shipping costs routinely consume a significant share of total business revenue, and most companies are leaving measurable savings on the table. Understanding how containerization generates cost reductions reveals exactly where those savings live, and what it takes to capture them.
Key Takeaways
- Containerization replaced manual break-bulk cargo handling, cutting per-ton loading costs by over 97%
- Standardized intermodal containers enabled economies of scale, faster port turnaround, and seamless multimodal transport
- Payload optimization, smarter shipment timing, and strategic port selection can drive meaningful savings on top of baseline container rates
- Detention, demurrage, and rate volatility are hidden cost drivers that can quickly erase container shipping savings
The Pre-Container Era and the Origins of the Cost Revolution
Break-Bulk Shipping: A System Built for Inefficiency
Before the 1950s, ocean freight moved as "break-bulk" cargo — individual crates, bags, and pallets loaded piece by piece into ship holds by longshoremen. A traditional cargo gang numbered 20 men or more per shift. Ships spent roughly as much time idle in port as they did at sea, a near 1:1 ratio of port time to sailing time.
At $5.83 per ton to load, shipping most manufactured goods internationally simply wasn't viable. The inefficiencies compounded at every step:
- Ports became chronic bottlenecks as ships queued for dock space
- Cargo theft during handling was widespread and difficult to prevent
- Weather exposure during loading caused routine damage to goods
Malcolm McLean's 1956 Solution
On April 26, 1956, a converted World War II oil tanker — the SS Ideal X — left Port Newark carrying 58 sealed steel containers measuring 35 feet long, 8 feet wide, and 8 feet high. Trucking entrepreneur Malcolm McLean's core insight was simple: if the container itself could be lifted directly onto a ship without unpacking, you eliminated most of the labor.
Loading time dropped from days to hours. Per-ton handling costs fell from $5.83 to under $0.16. The ship transformed from a floating warehouse into a scheduled transport asset.
The ISO Standards That Made It Scale
McLean's design solved the problem for one ship. Scaling it globally required a universal standard. ISO's freight container technical committee (ISO/TC 104) was created in 1961, with the first international dimension standards published between 1968 and 1970. Those standards — codified today as ISO 668:2020 — established the 20-foot and 40-foot units that every ship, crane, railcar, and chassis in the world is designed around.
Without that uniformity, a container packed in Shanghai would require specialized equipment at every port it touched. With it, the same box moves without specialized handling from factory floor to ship to rail to truck — at any port worldwide.
How Containerization Reduces Shipping Costs: The Core Mechanisms
Labor Cost Reduction
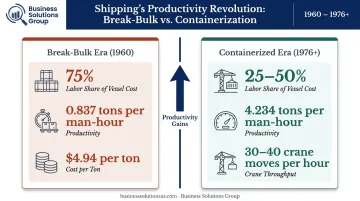
The numbers here are striking. Pacific Coast longshore productivity rose from 0.837 tons per man-hour in 1960 to 4.234 tons per man-hour by 1976 as containerization took hold. Labor cost per ton fell from $4.94 to $3.45 over the same period — even as wages rose.
Labor's share of total vessel operating cost dropped from roughly 75% for conventional cargo to 25–50% for containerships. Modern terminals now achieve 30–40 crane moves per hour, a throughput rate that would have been unimaginable in the break-bulk era.
Faster Port Turnaround and Vessel Utilization
Containers changed the economics of vessel ownership. Where break-bulk ships spent roughly half their working lives tied up at docks, containerships achieve an approximate 1:4 port-to-sea ratio — four times more time actually moving cargo.
More voyages per year means fixed vessel costs (fuel, crew, port fees, financing) are spread across greater cargo volume. The ship earns its keep instead of sitting idle.
Cargo Security and Insurance Savings
Sealed steel containers eliminated most of the theft, weather damage, and handling breakage common in break-bulk shipping. For importers, lower cargo insurance premiums and fewer claims translate directly to lower total landed costs — a savings category that rarely appears in rate comparisons but adds up quickly on high-value shipments.
Economies of Scale from Larger Vessels
Standardized containers made larger ships economically practical. The MSC Irina, delivered in 2023, carries 24,346 TEUs. Fixed voyage costs divided across 24,000 containers produce per-slot economics that were unthinkable on the first 58-container Ideal X.
One important caveat: the OECD/ITF found that cost savings from newer mega-ships are four to six times smaller than earlier gains, and that port congestion can transfer costs to shippers through delays and blank sailings. Scale economics are real but not unlimited.
Intermodal Integration
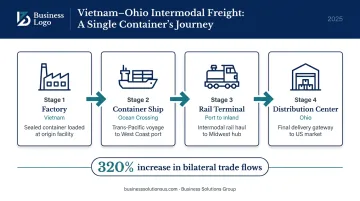
The same sealed container that leaves a factory in Vietnam can arrive at a distribution center in Ohio without ever being opened. That eliminates loading and unloading cycles at every mode handoff, each of which previously added cost, time, and damage risk.
This intermodal efficiency is what made global supply chains economically viable. Research by Bernhofen, El-Sahli, and Kneller estimated containerization raised bilateral trade flows among industrialized countries by approximately 320%. The Economist has argued containers drove globalization more than trade agreements — and the data supports the claim.
Containerization's Impact on Global Trade and Consumer Prices
Ocean liner shipping now moves 250 million containers and over $7 trillion of goods annually, according to the World Shipping Council. That scale rests on the cost efficiency containerization delivers.
That efficiency connects directly to consumer prices through manufacturing geography. When it costs under $0.16 per ton to move cargo instead of $5.83, producing goods in lower-cost regions and shipping them becomes economically rational. Electronics, apparel, and consumer goods assembled in Asia reach American shelves at prices that domestic production couldn't match — driven entirely by container economics.
That efficiency, however, cuts both ways. When the containerized system breaks down, prices spike fast. The Drewry World Container Index hit a pandemic peak of $10,377 per 40-foot container in September 2021 — compared to pre-pandemic norms well below $2,000. The 2021 Suez Canal blockage held up an estimated $9.6 billion of goods per day over six days. For businesses managing freight budgets, these swings underscore why understanding container cost structures — not just baseline rates — is critical to protecting margins.
Modern Strategies to Further Reduce Container Shipping Costs
Knowing how containerization cuts costs is useful. Knowing how to capture more of those savings is what moves the needle. Here are the strategies shippers can act on today.
Optimize Container Payload
Many FCL containers ship with meaningful unused space. Since the container rate, origin fees, destination charges, and drayage are fixed regardless of how full the box is, every additional unit of product you fit inside lowers your cost per saleable unit.
Practical improvements include:
- Redesigning packaging to reduce dead space and dimensional weight
- Floor loading instead of pallets where product permits
- Using slip sheets rather than pallets to recover 4–6 inches of vertical height in a 40-foot container
Use Buyer's Consolidation Programs
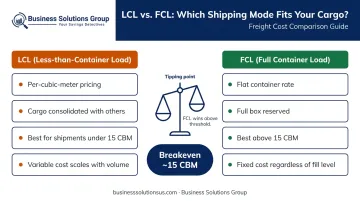
Smaller-volume shippers paying LCL (Less-than-Container Load) rates per cubic meter can often access FCL economics through a freight forwarder's consolidation program. By combining shipments from multiple suppliers into a single full container, you pay FCL rates even when no individual order would fill a box. As a general planning rule, once a shipment exceeds roughly 15 CBM, it's worth pricing a 20-foot FCL against LCL — the math frequently favors the full container.
Time Shipments Around Rate Announcements
Under 46 CFR 520.8, carriers must publish tariff rate increases at least 30 calendar days before they take effect. Shippers who monitor General Rate Increase (GRI) announcements can time bookings to ship before increases apply or delay until rates soften post-announcement. Avoiding peak season surcharges through flexible scheduling produces similar savings with no additional complexity.
Consider Alternate Port Routing
Not all ports carry the same handling fees, drayage costs, or rail connection economics. A shipment routed through a less-congested secondary port might cost more in ocean transit time but less in total door-to-door landed cost — particularly if it connects to lower-cost inland rail rather than expensive drayage.
Benchmark Your Rates and Negotiate Contracts
Most companies don't know whether their current container rates reflect what their freight profile should command. Systematic benchmarking against market rates — and negotiating service contracts that lock in terms before GRIs — can surface savings that aren't visible from invoice data alone.
Business Solutions Group's supply chain advisory services cover carrier contract negotiation and spend intelligence analysis — giving shippers the market context and negotiating leverage to close the gap between what they're paying and what their freight volume should command.
Hidden Costs and Risks That Can Offset Container Shipping Savings
Detention and Demurrage Fees
Carriers provide a limited "free time" window for container use at port. Once that window closes, daily fees accumulate — and they add up fast. Nine major carriers collected approximately $15.4 billion in detention and demurrage charges between April 2020 and March 2025, according to the Federal Maritime Commission.
The FMC distinguishes the two charges:
- Demurrage: Applies when a container isn't retrieved from the marine terminal within free time
- Detention: Applies when an empty container is returned late
Both can generate hundreds or thousands of dollars per shipment when documentation delays, trucking availability, or port congestion cause timing problems.
Managing free time terms in carrier contracts — and building internal processes that trigger pickup and return before deadlines — is one of the highest-return, lowest-visibility opportunities in container shipping cost management.
Carrier Market Concentration and Rate Volatility
The container shipping market is not a competitive commodity market. Major carrier alliances plus MSC controlled over 82% of global container capacity in 2025, according to industry reporting citing Alphaliner. That concentration means carriers can exercise significant pricing discipline during demand spikes — through blank sailings, capacity management, and coordinated rate increases — with limited competitive alternatives for shippers.
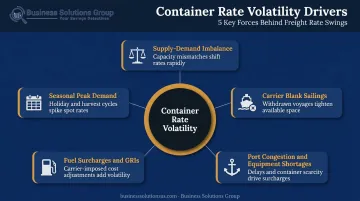
Rate volatility isn't random. It's driven by:
- Supply-demand imbalances between vessel capacity and cargo volume
- Carrier blank sailings reducing available capacity
- Port congestion and equipment shortages
- Fuel surcharges (BAF) and General Rate Increases
- Seasonal peak demand periods
Businesses that treat ocean freight as a fixed-cost line item rather than a managed category leave themselves exposed to spot rates that can triple baseline contract rates during peak disruption periods.
Systemic Disruption Risk
Rate exposure is one risk category. Operational disruption is another. The efficiency of containerized shipping depends on network reliability — when one link fails (a blocked canal, a congested port, a labor dispute) the effects cascade. Companies running just-in-time inventory models are especially vulnerable because they carry no buffer against transit delays.
Risk management steps that reduce exposure include:
- Diversifying routing across multiple carriers and ports
- Holding buffer inventory for high-criticality SKUs
- Structuring service contracts to include contingency transit options
Frequently Asked Questions
How has containerization reduced shipping costs?
Containerization replaced manual break-bulk cargo handling with mechanized, standardized steel container moves, cutting labor costs dramatically and enabling faster port turnaround. Combined with economies of scale from larger vessels and intermodal integration, per-unit shipping costs dropped by over 97% compared to pre-container handling methods.
What are the impacts of containerization on shipping?
Containerization standardized intermodal transport across sea, rail, and road, drove massive growth in global trade volumes, and lowered consumer goods prices by making offshore manufacturing economically viable. It also introduced structural risks — carrier market concentration, rate volatility, and exposure to network-wide disruptions.
What is the difference between FCL and LCL shipping costs?
Full Container Load (FCL) books an entire container at a flat rate regardless of how full it is, while Less-than-Container Load (LCL) charges per cubic meter or weight and combines your cargo with other shippers' goods. FCL generally becomes more cost-effective once a shipment approaches 15 CBM, though origin/destination charges and cargo density can move that breakeven point.
How do detention and demurrage fees affect container shipping costs?
Demurrage applies when a container isn't retrieved from the port terminal within free time; detention applies when an empty container is returned late — both charge daily fees. The FMC documented $15.4 billion in combined D&D charges from nine carriers over five years — a figure that reflects how rapidly daily fees compound when pickup or return logistics slip.
What causes container shipping rates to fluctuate?
Rate swings stem from a cluster of compounding factors: supply-demand imbalances between vessel capacity and cargo volume, carrier blank sailings, port congestion, equipment shortages, fuel surcharges (BAF), General Rate Increases, and seasonal peak demand. When several of these hit simultaneously, rates can shift sharply within weeks.
How can small businesses reduce container shipping costs?
Several tactics help smaller shippers compete on cost:
- Join buyer's consolidation programs through a freight forwarder to access FCL-equivalent rates
- Benchmark current rates against market indices and optimize packaging to maximize container payload
- Monitor GRI announcements to time shipments before increases take effect
Working with an NVOCC or advisory firm adds buying leverage that individual shippers rarely achieve on their own.